44.06028, -91.97694
Overview
This cases study compares whether plant species composition would be different between a clearcut and unharvested portions of a mature, southern mesic maple-basswood forest (MHs39b) forest after 5 years. It also assesses whether we are achieving our objective of regenerating oak and other desirable hardwoods.
MHs39 is a native plant community (NPC) of conservation concern in Minnesota, and thus management activities should not negatively impact biodiversity and rare plant species. MHs39b plant communities have a State Conservation Status Rank of S-3, rare or uncommon. S-3 ranked communities provide conditions that may benefit species that are not commonly found in other plant communities.
Data collected on this case study do not support that harvest caused losses in MHs39 species richness or of indicator plant species. While harvesting may have changed the structure of the MHs39 site, we see similar plant composition and greater diversity in the harvested site compared to the unharvested site 5 years after the timber harvest. Additionally, it appears the overall prescription has created conditions where we have good regeneration of desired trees for a future mature MHs39 plant community. Further, while invasive species were detected, the spread of invasive species into MHs39 communities does not appear to be a long-term threat to native plant species.
Silviculture Objective(s)
The objective was to conduct a clearcut with reserve harvest that would establish a young stand of red oak, white oak, and walnut through a combination of natural and artificial regeneration, all while maintaining the species diversity of an unharvested MHs39b community. Growing conditions were to be improved with post-harvest removal of weedy, invasive, and damaged woody species. An additional objective was to prevent the introduction and spread of invasive plant species.
Pre-treatment stand description and condition
Stand establishment and management history:
The stand originated around 1907 and was purchased by DNR’s Division of Wildlife in 1949.
Pre-treatment species composition:
Northern red oak, sugar maple, basswood, ironwood, and white oak
Pre-treatment growth and stocking:
95 years old. 5.2 cords per acre. The harvested stand had 95.0 square feet per acre of basal area. The unharvested control had 113.3 square feet per acre of basal area. Fully stocked.
Pre-treatment forest health issues:
None
Landowner objectives/situation:
While specific objectives vary from parcel to parcel, lands under the administration of DNR-Forestry are managed in alignment with Section Forest Resource Managment Plans (SFRMP) to ensure that state forest management activities meet statewide goals for ecological protection, timber production, and cultural/recreational values. The DNR assembles teams from the Divisions of Forestry, Fish & Wildlife, and Ecological & Water Resources who work with partners and the public to develop SFRMPs.
MN DNR’s Bluffland SFRMP pertinent goals for this stand include:
- Maintain and increase oak and walnut as a component of upland forest communities, while minimizing other northern hardwood tree species
- Manage G1, G2, G3, S1, S2, and S3 ranked NPCs to maintain ecological integrity and biodiversity (MHs39b is ranked as S3, while MHs39a is ranked S2)
- Residual trees selected to provide seed, and to target select species (quality oak) in harvest and site prep areas
- Increase target species through planting, inter-planting, and artificial or natural seeding (mast-producing species)
- Implement measures that protect rare features (reducing introduction/spread of invasive species)
- Maintain habitat: cavity trees, perches, woody debris, and riparian areas
- Protect advance regeneration. Retain conditions that favor regeneration and understory initiation
- Apply special management to high quality examples of rare NPCs
Silviculture Prescription
The prescription included a clearcut with reserves on 24 acres of a 61 acres stand. An adjacent and similar stand served as an unharvested control. Trees to be harvested were marked with orange paint. A minimum of 5 reserve trees per acre were to be left. Reserve trees were to be larger saw log trees of oak, walnut, and basswood. The site was to be planted before the harvest to 300 northern red oak, 300 white oak, and 100 walnut per acre. We planned a post-harvest treatment to fell damaged trees, undesirable trees, and invasive species and to treat other undesirable vegetation with herbicide.
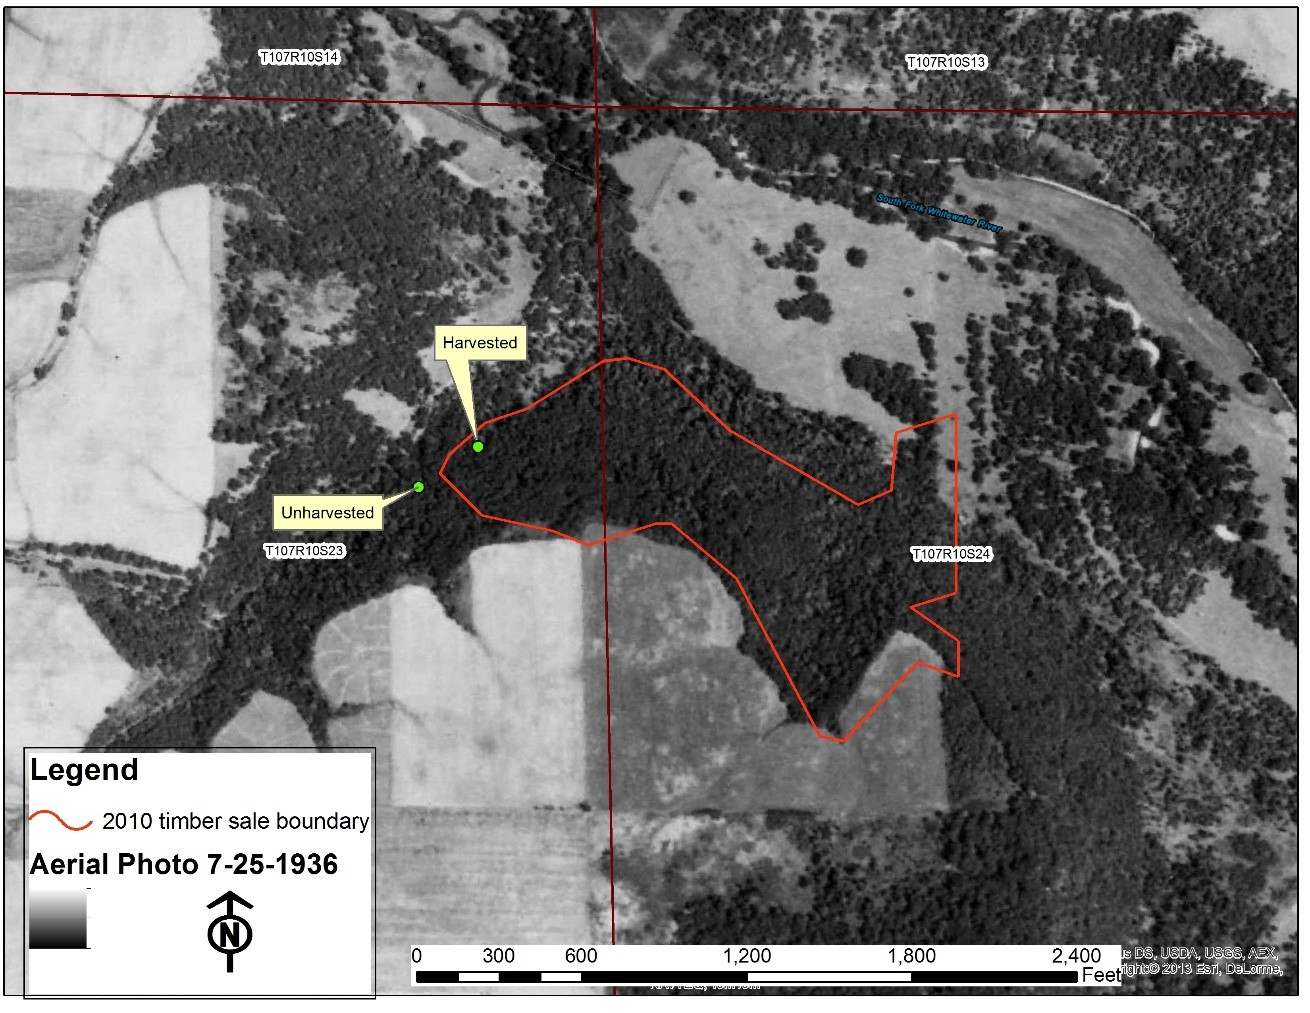
Figure 1: Aerial image showing land cover of the stand from 1936
What actually happened during the treatment
Northern red oak, white oak, and walnut seedlings were planted in the understory of the stand in the spring 2010 at a density of 700 seedlings/acre.
The stand was logged using a cable skidder from June 2011 to May 2013. Logging roads were created at a slope not greater than 20 percent. After the logging, the roads were water barred and seeded to a grass mix. Logging was halted during the firearms deer seasons. Less desirable trees (elm, box elder, ironwood), invasives, and damaged trees were felled post-harvest and the stumps of weed species were treated with Garlon 4 to prevent resprouting.
Table 1: All species by category in unharvested and harvested portions.
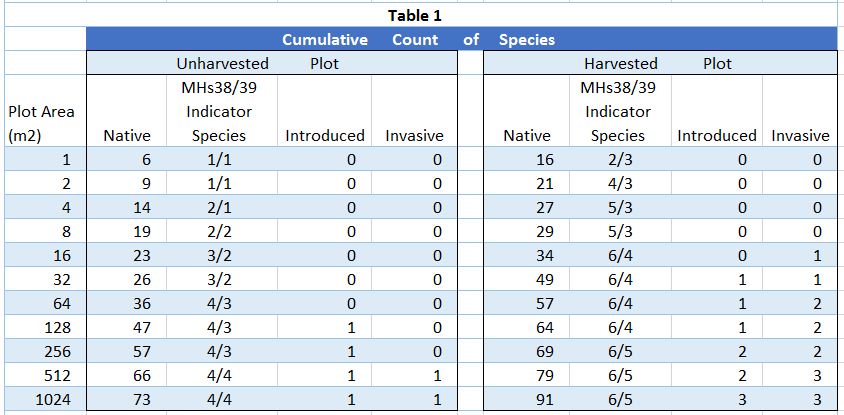
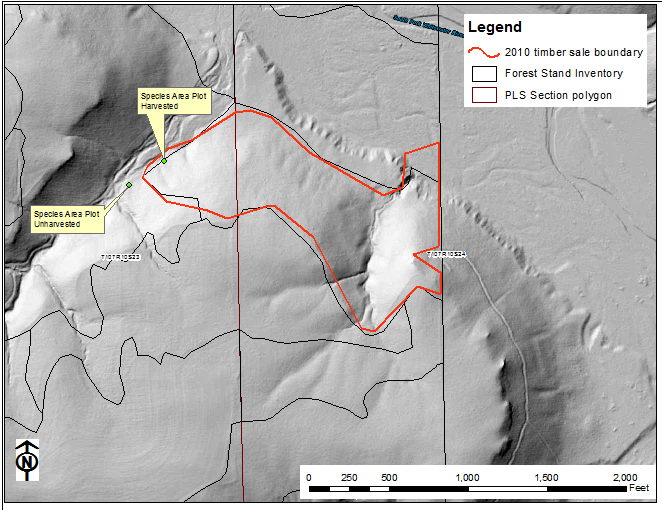
Figure 2: Aerial image showing topography of the stand from 2010
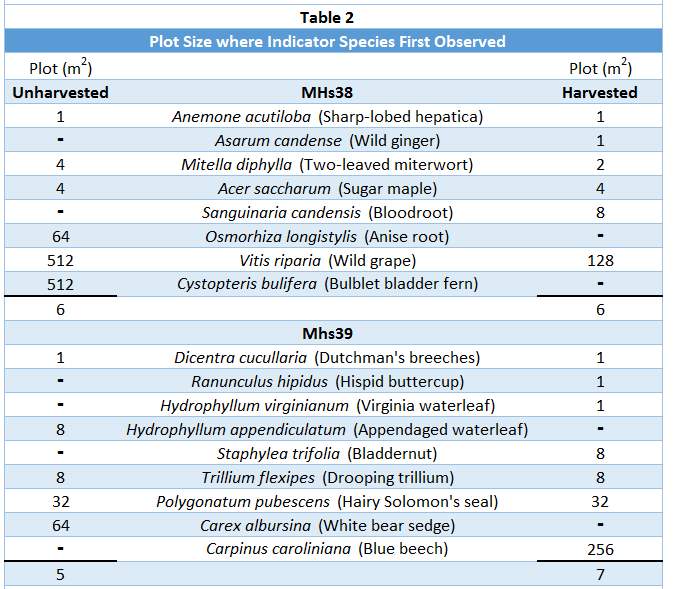
Table 2: MHs38 and MHs39 indicator species and the scale at which they were detected.
Post-treatment assessment
In order to assess if the harvest impacted plant diversity, specifically richness, we installed two species-area curve plots. One was placed in the unharvested site and the other in the nearby harvested site, about 225 feet apart (see image below). The plots were done by starting at 1 square meter and noting the presence of all plant species within that area and then doubling the plot size ten times until 1024 square meters is reached. As the area was expanded we noted all newly observed plant species.
The harvested plot had a greater number of native species at 91 than the unharvested plot with native 73 species (Figure 1 and Table 1).
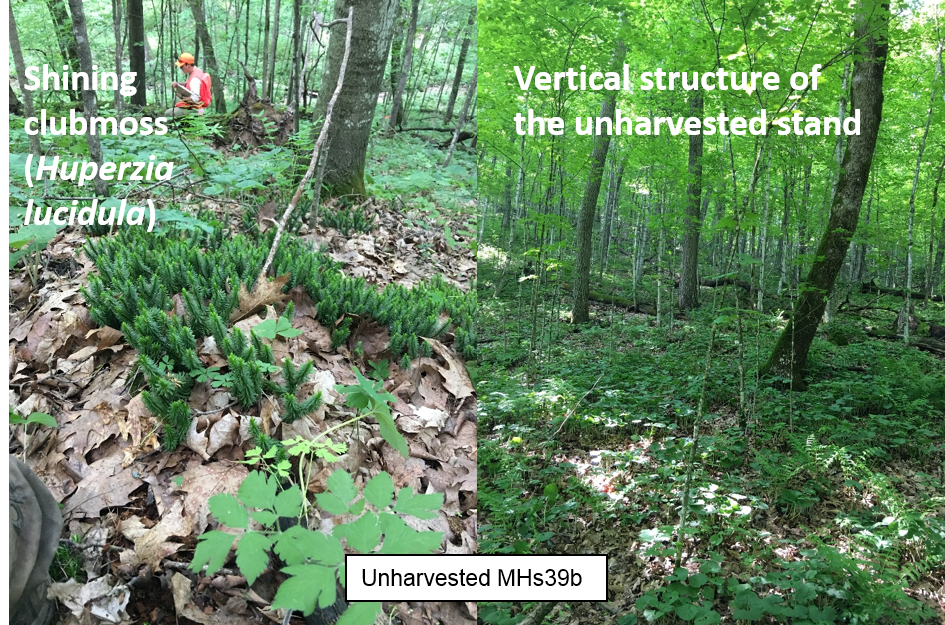
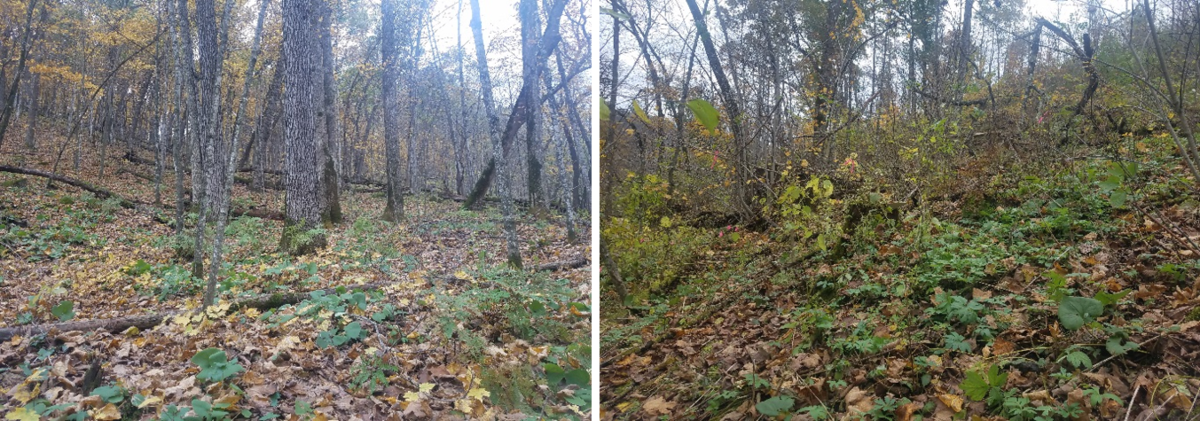
Figure 3: Shining clubmoss and vertical structure of unharvested MHs39b
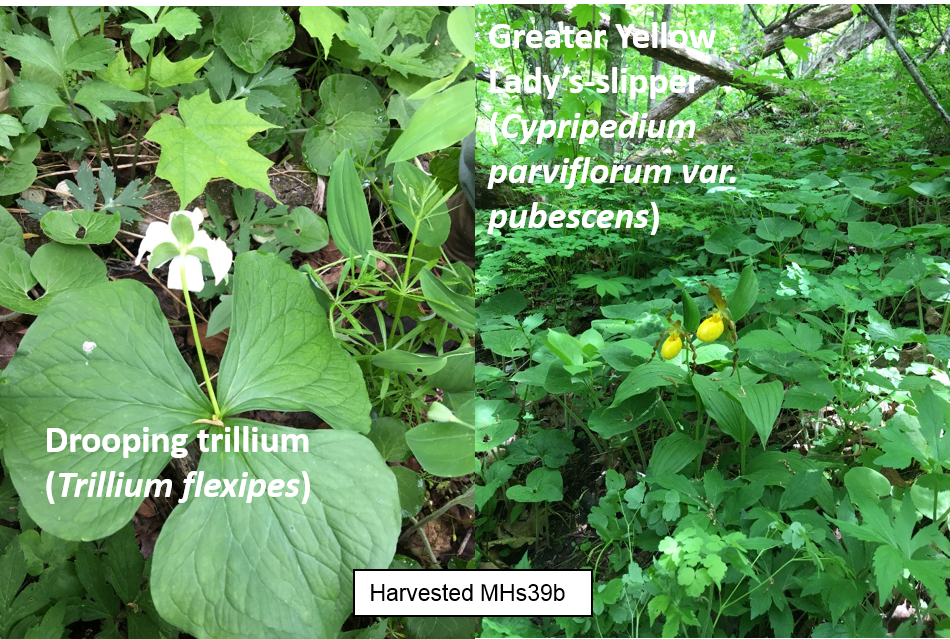
Figure 4: Drooping trillium and greater yellow lady's-slipper in harvested MHs39b
Additionally, Table 1 shows that the harvested plot has the same number of species that are considered MHs38 indicator species and more MHs39 indicator species than the unharvested plot. MHs38 and MHs39 indicator species for both plots are shown in Table 2 (attached) listed by the plot size in which they were first observed. The individual plot reports that highlight indicator species are in the supplemental content section.
This increase in species could be caused by an increase in sunlight due to the gap openings created from harvesting.
The harvested site also had more introduced and invasive species than the unharvested site (6 and 2, respectively; Table 1). The introduction of invasive and introduced species during logging is another potential threat to rare plant species. At the time of the harvest, the sale regulations required all logging equipment to arrive visually clean of soil, seeds and vegetative manner. Five years later only the harvested plot had invasive Canada thistle and reed canary grass, and introduced giant chickweed and dandelion present, although not in high numbers. In this forested setting, these species are not overly worrisome, because once the trees become established they will likely be shaded out. Common buckthorn and common burdock which were present in both plots and likely introduced by birds and animals, pose a more serious threat to the stand’s biodiversity.
In addition to observing changes to plant diversity, we wanted to know the current composition of trees to see we were achieving our goal of establishing oak in the next stand. We measured basal area in fixed area plots in both the unharvested and harvested areas as well. Basal area per acre in the unharvested site is 113 square feet per acre. Basal area per acre in the harvested site is 59 square feet per acre. Due to northern red oak being the major timber sale component, it had the largest change in basal area from 46.7 sq. ft. per acre in the unharvested site to 7.0 sq. ft. per acre in the harvested site (Table 3). Sugar maple’s BA didn’t change much since it was a large component of the remaining pole sized trees.
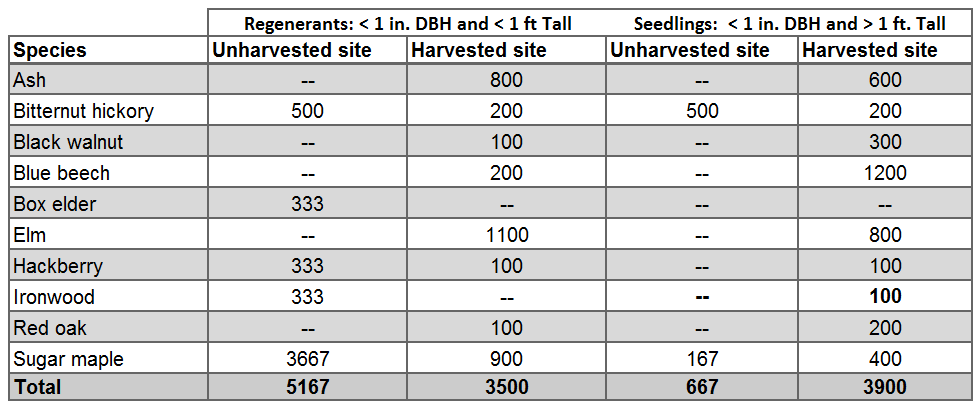
The harvest created a growing environment that favored the planted oak and walnut regeneration. In the harvested site there were 300 oak seedlings per acre and 400 walnut seedlings per acre (Table 4, attached). Conversely, there was no oak or walnut regeneration in the understory of the unharvested site.
Table 3: Basal area by species for each site
|
Species |
Unharvested site |
Harvested site |
|
Northern red oak |
46.7 |
7.0 |
|
Sugar maple |
40.0 |
35.0 |
|
Basswood |
11.7 |
11.0 |
|
Ironwood |
8.3 |
-- |
|
White oak |
5.0 |
3.0 |
|
Ash |
1.7 |
-- |
|
Black walnut |
-- |
1.0 |
|
Bitternut hickory |
-- |
1.0 |
|
Big-tooth aspen |
-- |
1.0 |
|
Total Basal Area (ft2/ac) |
113.3 |
59.0 |
Table 4: Tree stem count of the regenerant and seedling layers.
Plans for future treatments
In the harvested area, a regeneration survey will be done in 2023. If sufficient desirable regeneration continues to exist, a crop tree release project will be conducted to provide free to grow conditions for these trees.
The unharvested area is not on the DNR’s current 10-year stand exam list (expiring in 2024) so it will not be reviewed for potential management until sometime after that.
Costs and economic considerations
Timber Sale Proceeds: $3,015/acre
Post-Harvest Control of Undesirable Woody Species: -$133/acre
Tree Planting: -$504/acre
Timber Sale Receipts Minus Establishment Costs: $2,378/acre
Other notes
This case study was reviewed by MN DNR ECS and Silviculture Program Staff Michelle Martin and Mike Reinikainen. Case study submitted on 08/09/2019.
Summary / lessons learned / additional thoughts
Our results indicate that timber harvest increased native species richness and MHs39b indicator species. While harvesting may have changed the structure of the MHs39 site, we observed greater diversity in the harvested site compared to the unharvested site 5 years after the timber harvest. There appears to be an increase in native species richness 5 years after harvesting.
The spread of invasive species into MHs39 communities does pose a significant threat to many native plant species. The non-native species that may have been introduced during this harvesting should not have a significant long term negative impact on this plant community. However, this case study shows the importance of inspecting logging equipment upon arrival to the job site for weed seeds, monitoring for invasives species after the harvest, and if needed, treating any invasives that are a serious threat to the native plant community.
The prescription created favorable conditions to support a diverse mix of tree regeneration bolstered by an underplanting of oak and walnut. We feel this stand is on track to the desired future condition of a mature MHs39 native plant community.
Supplemental content
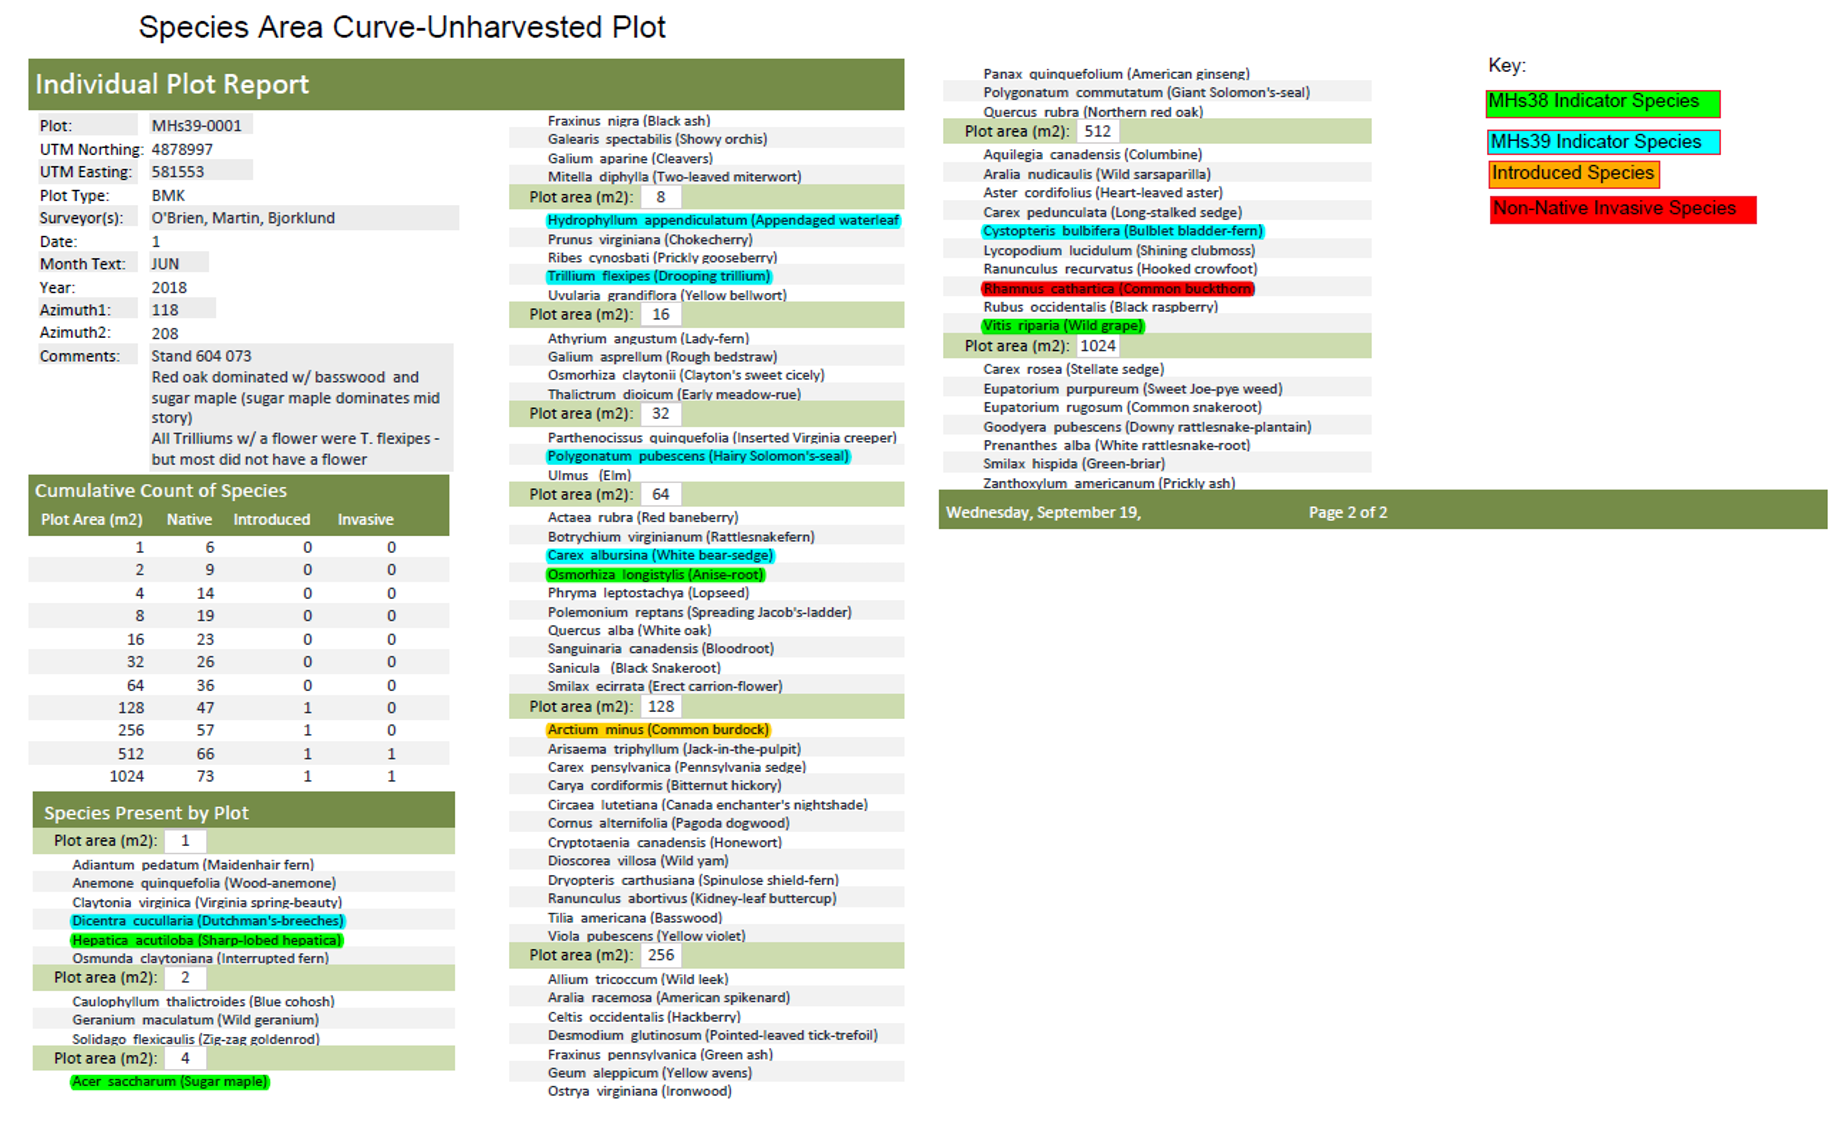
Species area curve for unharvested plot
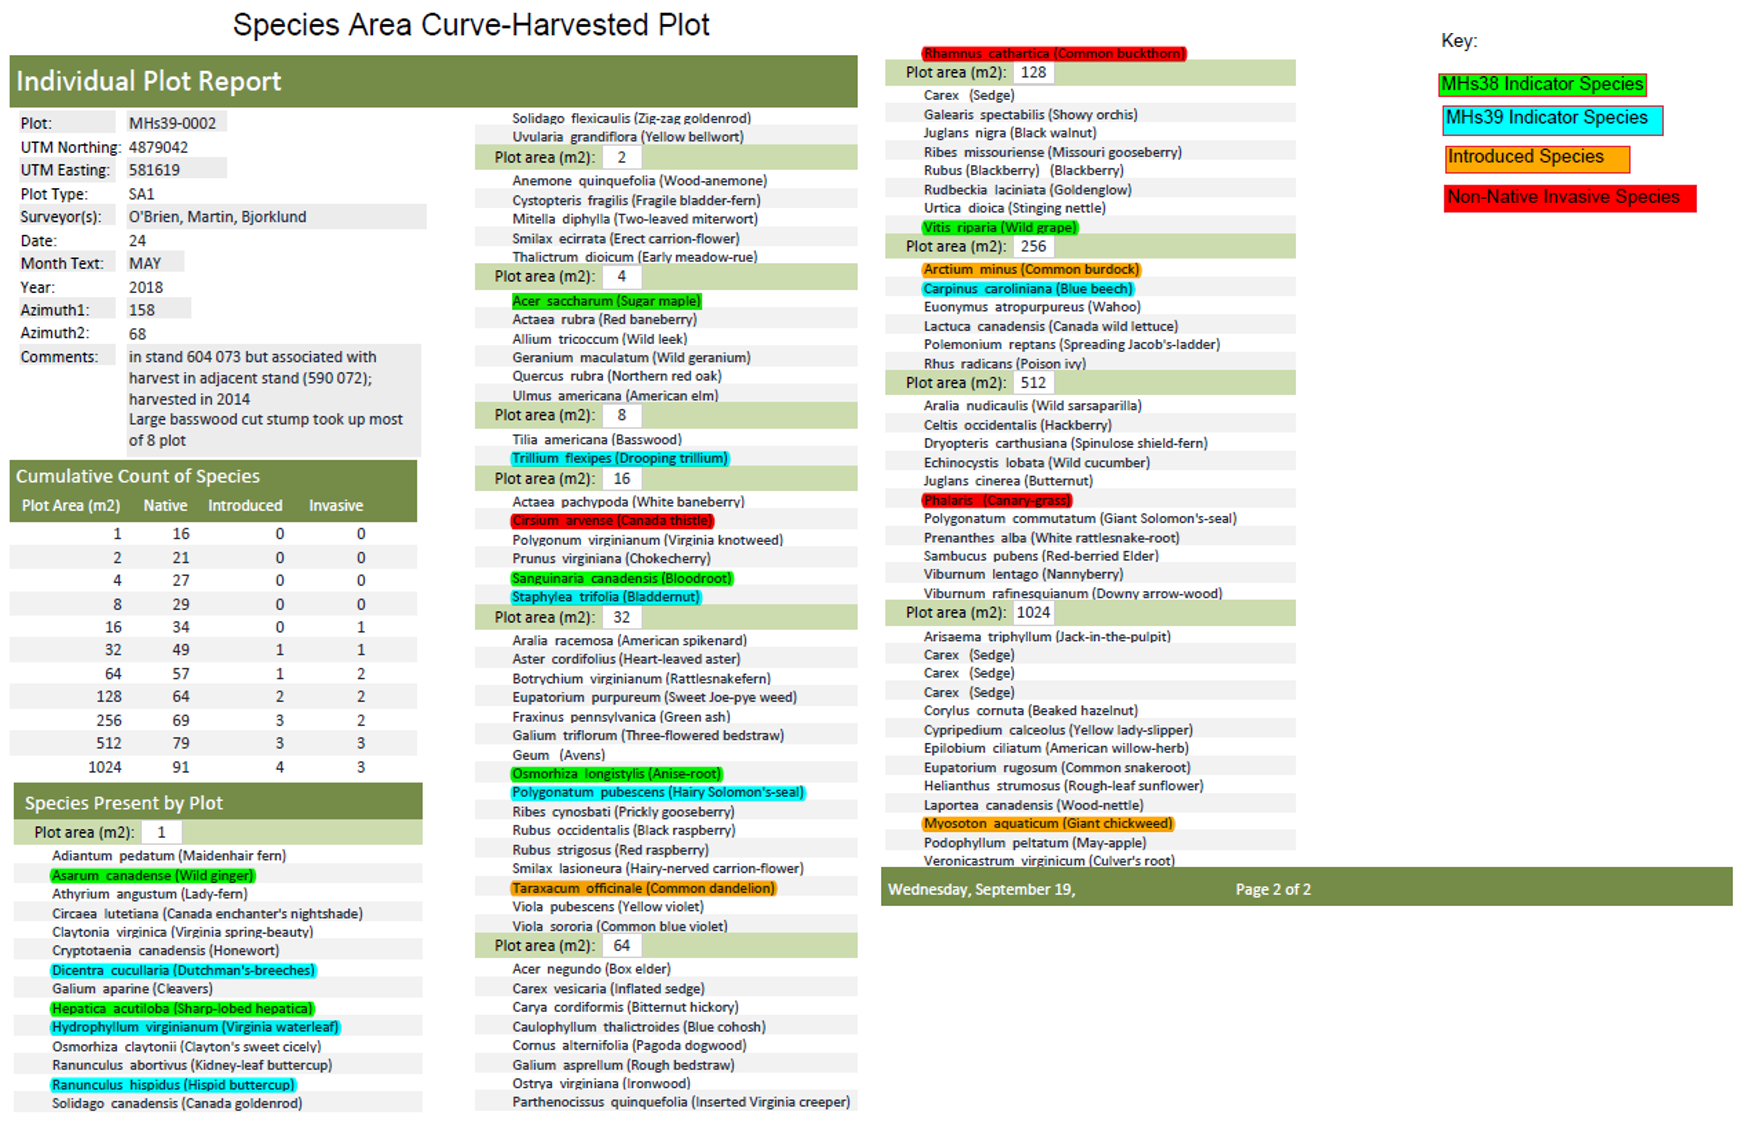
Species area curve for harvested plot
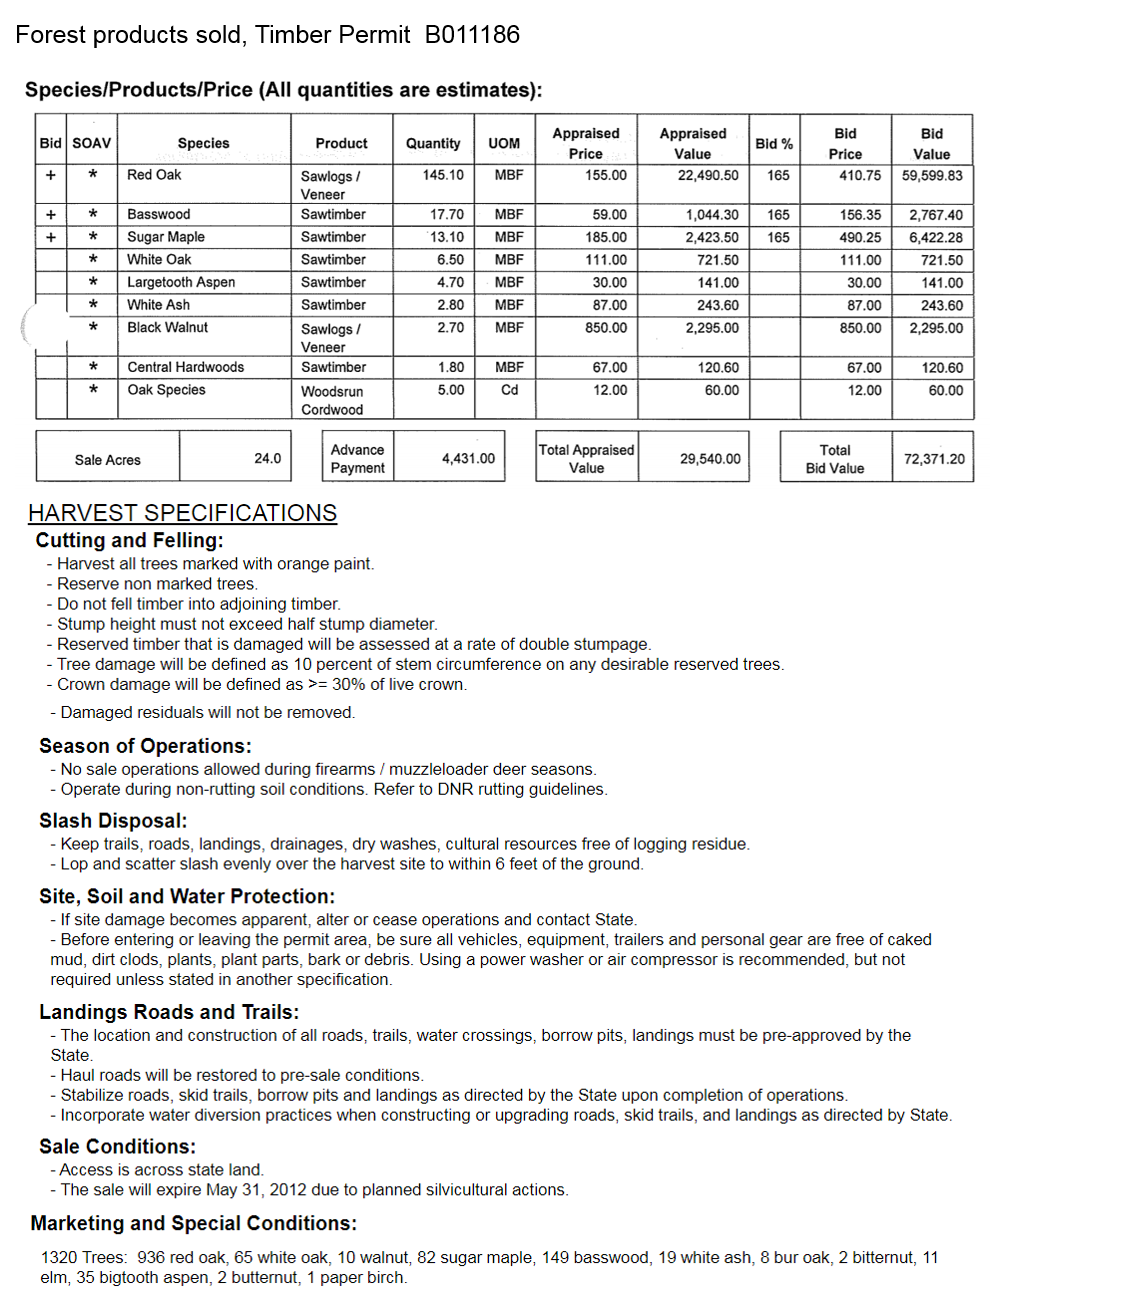
Forest products sold timber permit