
46.251067, -92.389309
Overview
Case Study Objectives
- Our main objective was to assess the impacts of post-thinning basal area on epicormic branching in oak species and determine target post-thinning basal area to be incorporated into future thinning practices.
- An additional objective was to try to assess impacts of tree health and condition, and native plant community (NPC) on epicormic branching. Again, this information would be useful in designing future thinning practices.
- A final objective was, if possible, to develop post-thinning stand ingrowth information for use in updating oak stand growth models to better inform forest planning efforts. This would help us establish more realistic re-entry periods for thinning practices.
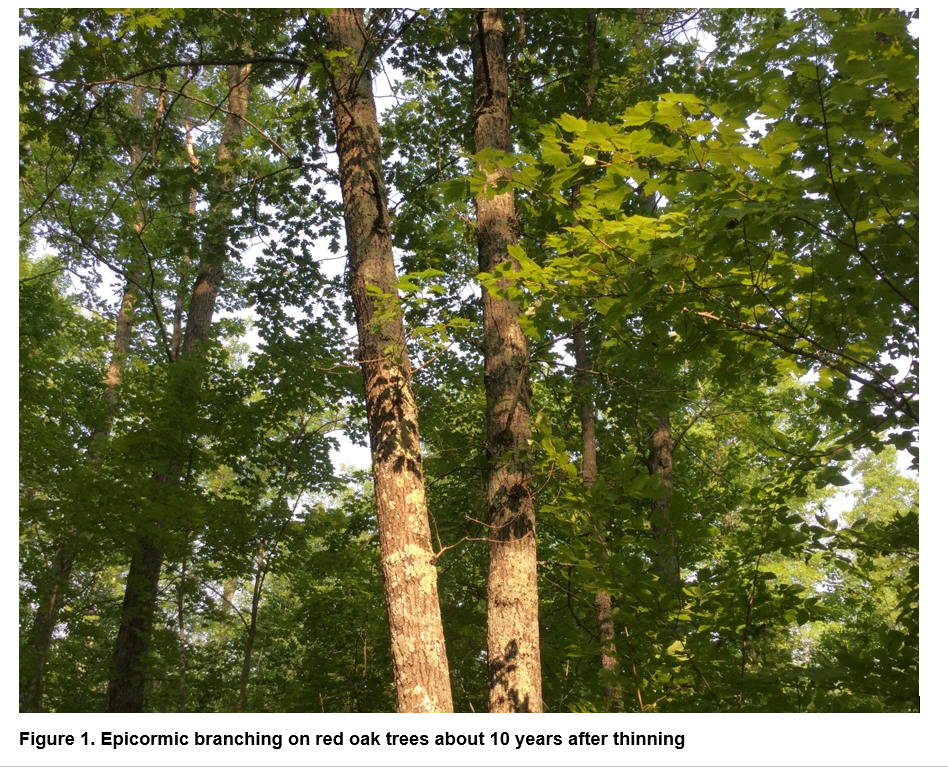
Figure 1: Epicormic branching on red oak trees about 10 years after thinning.
Background
In the Sandstone DNR-Forestry administrative area, a considerable amount of thinning in oak stands was done between the years 2000 to 2010. Three of the major factors driving this work were:
- Professional interest of Forest Technician Bill Foss in hardwood management.
- Large acreage of oak and hardwood forest types reaching age and condition to make them good candidates for thinning.
- Existence of improved markets for hardwood timber in the area.
Forestry staff noticed greater-than-desired levels of post-thinning epicormic branching on oaks in some of these thinned stands; also, post-thin ingrowth was below expectations under existing modeling.
Study design
We selected six previously thinned sites where we had observed varying levels of epicormic branching during field examinations. Data was collected on basal area, tree diameter, age, crown canopy class, and number of epicormic branches in the lower 32 feet, in the summer of 2019.
Since we did not have data for basal area immediately after thinning, an estimate was calculated using tree-ring core measurements of tree diameter growth since harvest.
Further details of data collection methods and calculations are outlined in Figure 6.
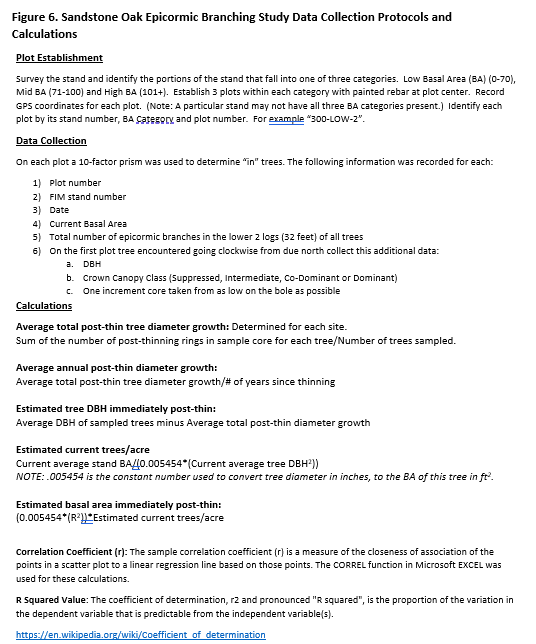
Figure 6: Sandstone oak epicormic branching study data collection protocols and calculations.
What is epicormic branching and why is it important?
Excerpted from the document “Epicormic Branching In Red Oak Crop Trees Five Years After Thinning And Fertilizer Application In A Bottomland Hardwood Stand”; Lockhart, Michalek, and Lowe:
Epicormic branches are shoots arising from dormant buds on stems or branches of woody plants, often following stress and exposure to increased light levels after thinning, storm damage or fire (Helms 1998).
Epicormic branches are considered defects on tree boles because they result in undesirable knots on trees, reducing the monetary value of logs and lumber (Stubbs 1986). U.S. Department of Agriculture Forest Service factory log grade guidelines indicate that the size of the epicormic branch, in addition to the number and location of epicormic branches on the log, is important in determining log grades (Rast and others 1973). If an epicormic branch is > 3/8 inch in diameter at the point of origin on the log surface, then it is counted as a full defect; an epicormic branch ≤ 3/8 inch in diameter is only counted as a one-half defect on logs ≥ 14 inches in scaling diameter (Rast and others 1973). Theoretically, even a single, large epicormic branch ideally positioned on a small log can reduce the grade of the log. Meadows and Burkhardt (2001), in a case study using willow oak (Quercus phellos L.) logs, showed that as few as five epicormic branches on a 16-foot log reduced the log grade of trees with an average diameter at breast height (d.b.h.) of 19.1 inches. They also showed that epicormic branches developing on willow oak boles after partial cutting reduced willow oak log grades by 50 percent. The value of the lumber from these logs was reduced 13 percent due to surface knot defects caused by the epicormic branches.
A primer on timber quality and market value
Since we do most forest management through commercial timber harvest, improving timber value and marketability of a stand can improve forest management opportunities. Hardwoods are mostly used in products such as furniture, where appearance is the driving factor in determining value. Two major factors drive hardwood timber value:
- Appearance: Larger, straighter trees with few limbs on the lower bole and little or no rot produce boards with few appearance defects such as knots and are therefore worth more money.
- Species: Species is also a huge factor driving market value and red oak is consistently one of the highest demand species in the hardwood marketplace.
Silviculture Objective(s)
- Oak crop tree release to improve timber quality, stand health and mast production for wildlife.
- Capture merchantable aspen volume before mortality.
Pre-treatment stand description and condition
Stand establishment and management history:
There are six separate sites in the study, each with a different origin year. The stands vary from 62 to 108 years old. Many hardwood stands in the Sandstone Area originated after the control of fires post-European settlement.
Pre-treatment species composition:
Stands included a mixture of central and northern hardwoods species, including red oak, aspen, red maple, paper birch, basswood, and minor amounts of a variety of other hardwoods.
Pre-treatment forest health issues:
Some oak mortality was noted on the timber appraisal for site 2.
Landowner objectives/situation:
While specific objectives vary from parcel to parcel, lands under the administration of DNR-Forestry are managed in alignment with Section Forest Resource Management Plans (SFRMP) to ensure that state forest management activities meet statewide goals for ecological protection, timber production, wildlife habitat and cultural/recreational values. The DNR assembles teams from the Divisions of Forestry, Fish & Wildlife, and Ecological & Water Resources who work with partners and the public to develop SFRMPs.
The Minnesota DNR goal was to increase oak forest acreage in this section.
Silviculture Prescription
The following series of treatments were implemented:
|
Treatment |
Date |
Description |
Acres Treated |
|
Silvicultural assessments and timber sale appraisals |
2004 through 2012 |
Timber was appraised for sale and stands were assessed to determine a silvicultural strategy. |
275 |
|
Thinning harvests |
2005 through 2013 |
Stands were selectively thinned to release crowns of desirable crop trees, especially oaks. Target post-thin basal area of 80 ft2/acre. The prescription was the same for all 6 study sites. |
275 |
What actually happened during the treatment
It was common on these sites to end up with a bit less basal area after thinning than prescribed. The main reason for this was that most aspen trees were harvested during the thinnings to capture merchantable volume before mortality. Also, the focus was more on crop tree release than on an exact target basal area.
Post-treatment assessment
R and R squared values were calculated for number of epicormic branches by basal area, crown class, diameter at breast height and native plant community to estimate potential correlations.
Background on correlation analysis
To see how closely two variables relate to one another, we can use the correlation coefficient r. It is a measure of the strength and direction of a linear relationship between two variables on a scatterplot.
Correlation coefficient formulas are used to find how strong a relationship is between data. The formulas return a value between -1 and 1, where:
- 1 indicates a strong positive relationship.
- -1 indicates a strong negative relationship.
- A result of zero indicates no relationship at all.
The closer the value is to 1 or -1, the higher the correlation shown between variables. Interpretation of the values is always somewhat subjective, but for general context it may be helpful to know that a rule of thumb statisticians that work with correlations sometimes use is that values less than .5 or -.5 indicate very weak correlation.
R squared is a variable that indicates how much our response variable changes with the change in predictor variable. It is always between 0 and 1.
Results
As shown in Figure 2, there does not appear to be much correlation between Basal Area and epicormic branching. The R-squared value is .0679.
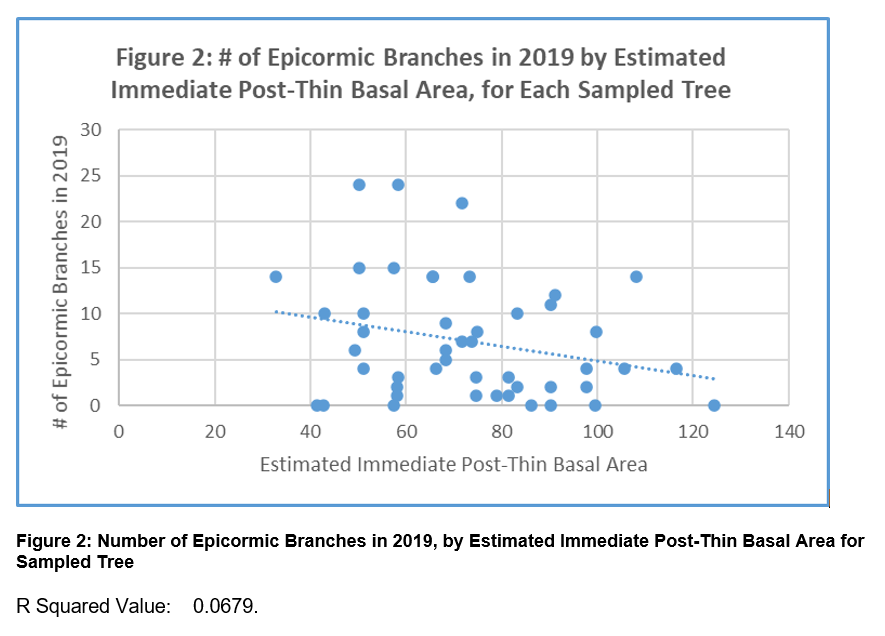
Figure 2: Number of epicormic branches in 2019, by estimated immediate post-thin basal area for sampled tree
As shown in Figure 3, there appears to a moderate positive correlation between Crown Class and epicormic branching. This makes some intuitive sense, since dominant trees are likely to be most healthy and therefore less in need of an epicormic branch response to stress or change in light conditions. The R-squared value is 0.322.
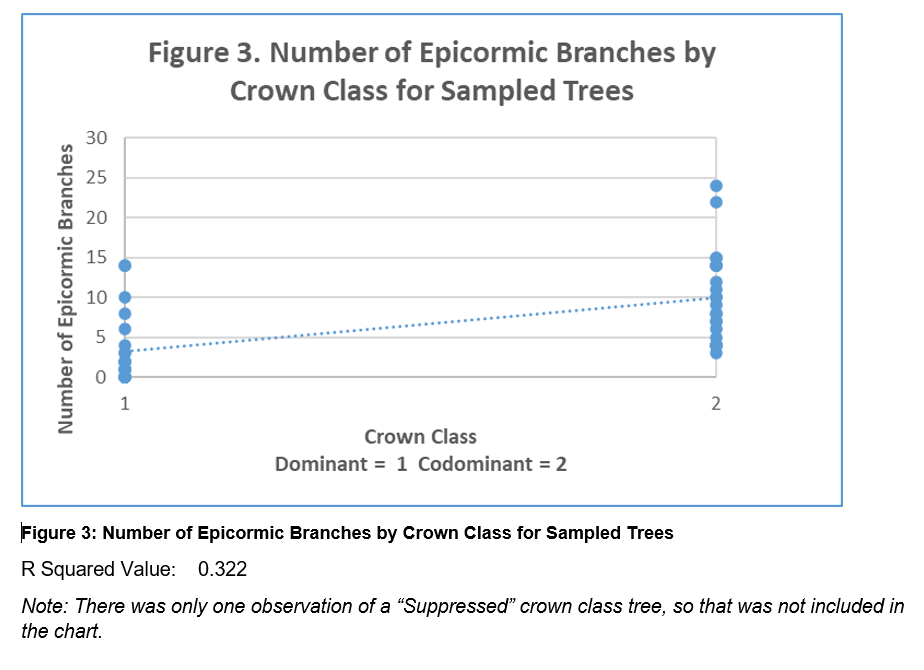
Figure 3: Number of epicormic branches by crown class for sampled trees
As shown in Figure 4, there does not appear to be much correlation between DBH and epicormic branching. The R-squared value is 0.0736.
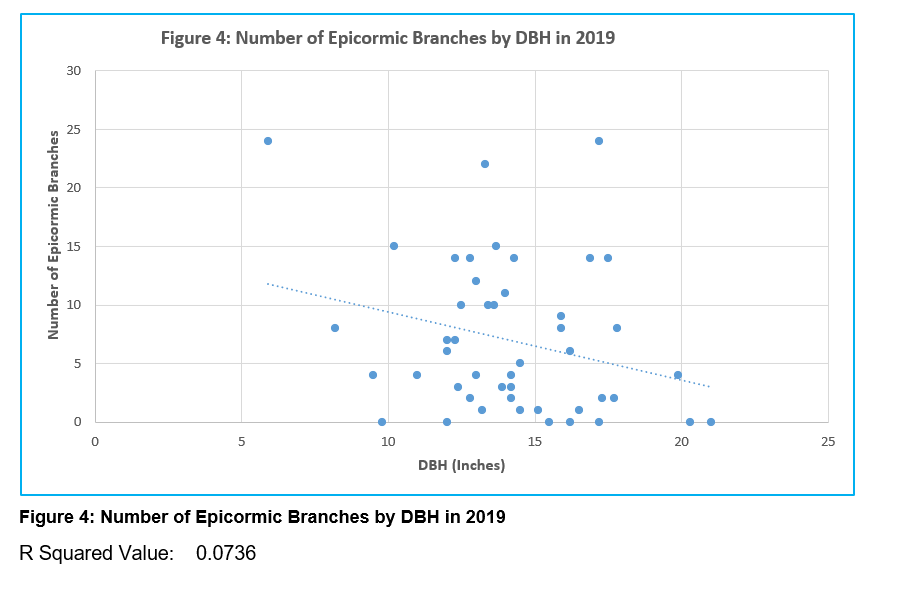
Figure 4: Number of epicormic branches by DBH in 2019
As shown in Figure 5, the data indicates only very low correlation between NPC and epicormic branching. The R-squared value is 0.0265.
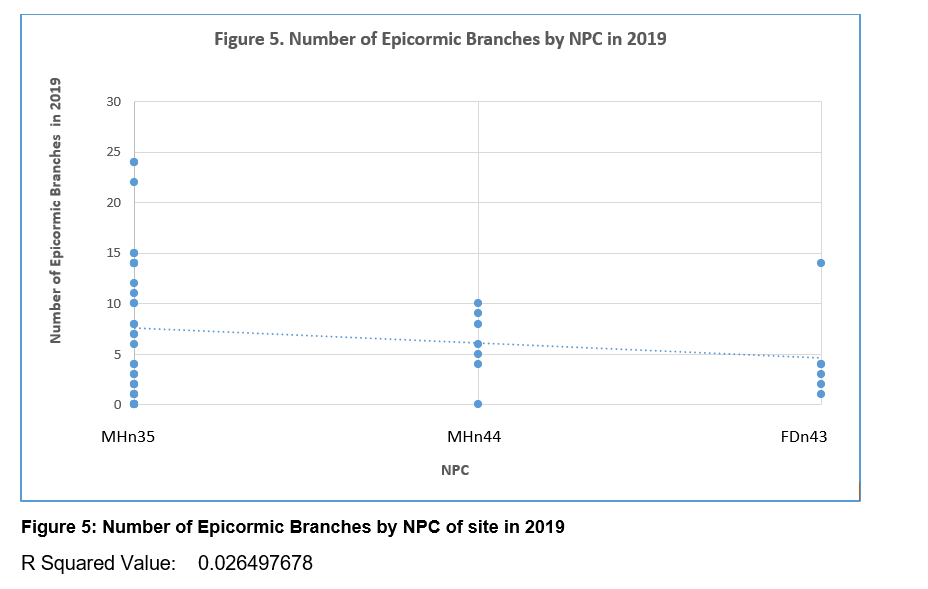
Figure 5: Number of epicormic branches by NPC of site in 2019
Growth after thinning
One of the objectives for this case study was to calculate stand level basal area in-growth since thinning harvest for potential use in refining growth models. Average annual tree diameter growth and annual basal area ingrowth for each study site is shown below in Table 3.
Table 3: Average Annual Tree Diameter Growth, and Annual Basal Area Ingrowth Since Thinning for 6 Case Study Sites
|
Site # |
NPC |
OAK SI |
Age in 2019 |
Years since thinning |
Average annual diameter growth of trees since thinning (inches) |
Average Annual BA ingrowth since thinning (ft2/ac.) |
|
1 |
MHn35 |
64 |
98 |
9 |
0.153 |
1.745 |
|
2 |
MHn44 |
58 |
108 |
6 |
0.18 |
1.649 |
|
3 |
MHn35 |
55 |
86 |
9 |
0.158 |
1.667 |
|
4 |
MHn35 |
63 |
62 |
10 |
0.181 |
2.509 |
|
5 |
MHn35 |
70 |
79 |
9 |
0.137 |
1.912 |
|
6 |
FDn43 |
67 |
100 |
14 |
0.101 |
1.465 |
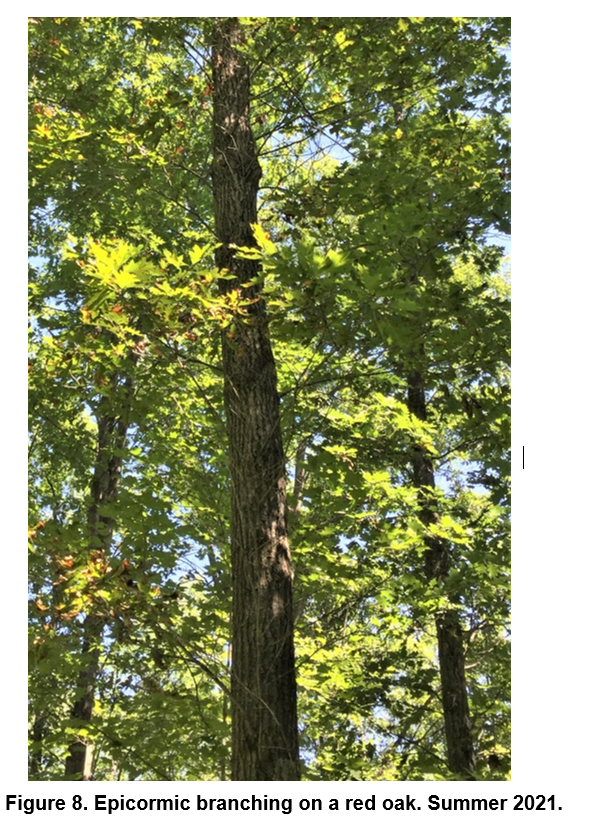
Figure 8: Epicormic branching on a red oak in summer of 2021.
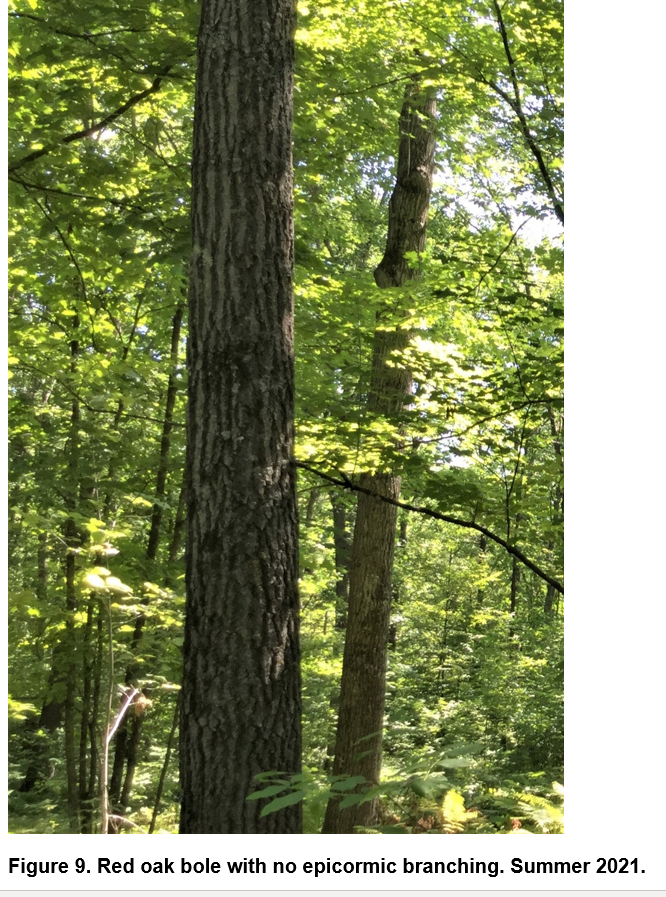
Figure 9: Red oak bole with no epicormic branching in summer 2021.
Plans for future treatments
Most of these stands will be field visited soon to evaluate them for regeneration strategy
Costs and economic considerations
Cost and Revenue Notes:
- Cost and revenue figures below are estimated averages from personal knowledge of co-authors.
- Impacts to costs and revenue of doing the study were minimal since this was a retrospective study of traditional thinning practices.
Costs
Thinning timber sale setup and administration: $50/acre
Revenue
Timber sale: $225/acre
Other notes
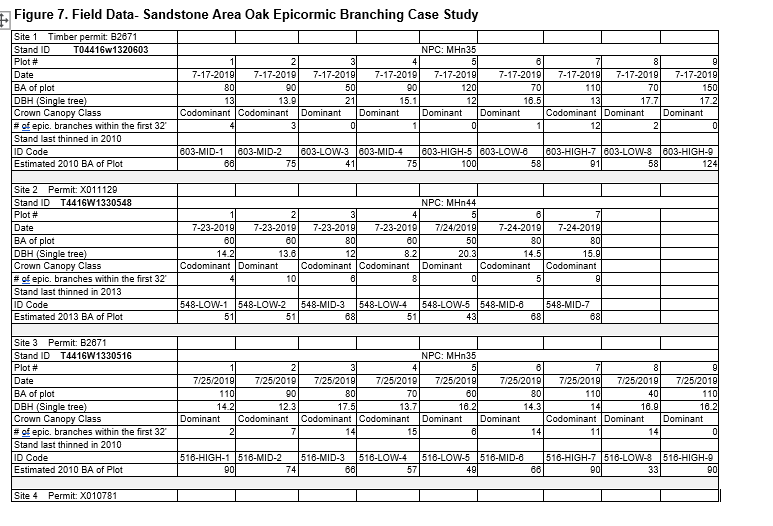
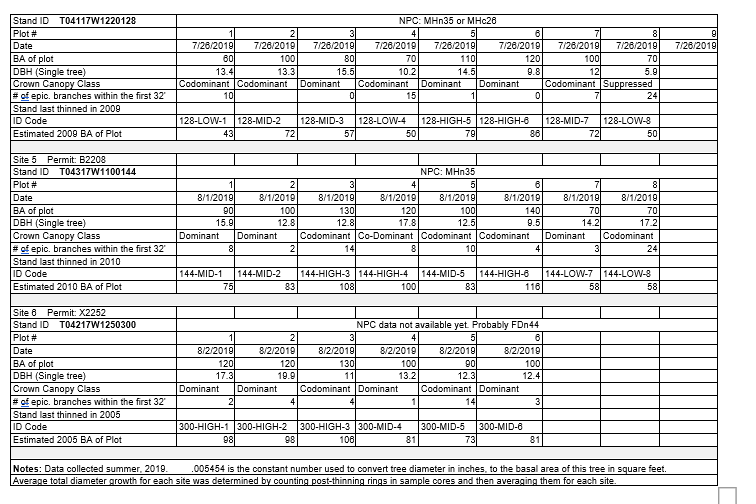
Figure 7: Field data for Sandstone area oak epicormic branching case study pages 1 and 2.
We gratefully acknowledge the data-gathering assistance of Forestry Intern Ben Wilson, and the study review and editing assistance of DNR ECS Program Consultant Ashlee Lehner and DNR Program Forester Cody Crawford.
This case study was developed with support from the United States Department of Agriculture's National Institute for Food and Agriculture, Renewable Resources Extension Act. Project #2021-46401-35956, principal investigator Eli Sagor, University of Minnesota.
Summary / lessons learned / additional thoughts
Post-thin basal area appears to have little impact on epicormic branching and therefore log grade and timber value.
The R squared value for epicormic branching and basal area in our study was 0.068.
Crown class was the only factor we assessed that appears to have a moderate correlation to epicormic branching levels.
Of the four variables we assessed, only crown class showed at least a moderate correlation to epicormic branching levels. The r squared value is 0.322. Dominant trees exhibited less post-thin epicormic branching than co-dominant trees, probably because dominant trees typically are the most vigorous and healthy specimens in a stand.
Existing literature indicates that factors such as tree health and vigor, genetics, and environmental stressors such as drought appear to have much bigger impacts on epicormic branching than post-thin basal area.
Two research studies we reviewed showed that healthy, vigorous trees that exhibit a low tendency for epicormic branching before a thin are unlikely to exhibit heavy epicormic branching after a thin.
Lockhart, Michalek and Lowe (2004). Epicormic Branching in Red Oak Crop Trees Five Years After Thinning and Fertilizer Application in a Bottomland Hardwood Stand.
https://www.srs.fs.usda.gov/pubs/gtr/gtr_srs092/gtr_srs092-140-lockhart.pdf
Miller (1995). Epicormic Branching on Central Appalachian Hardwoods 10 Years After Deferment Cutting.
https://www.fs.fed.us/ne/newtown_square/publications/research_papers/pdfs/scanned/OCR/ne_rp702.pdf
Selection of retained red oak crop trees probably has a much larger impact on amount of epicormic branching and log defect than how heavily a stand is thinned.
Retaining healthy oaks that exhibit low amounts of epicormic branching is probably the best strategy for minimizing post-thin epicormic branching defects in red oak. Over time, foresters can probably develop an “eye” for epicormic branching likelihood by observation of factors like existing epicormic branching, crown class, tree health and vigor and even bark patterns.
It would also be good for foresters to be aware that because red oak in central Minnesota is on the edge of its natural range, it may be more susceptible to additional stressors and epicormic branching than those trees found in the heart of its range.
We will make our data available to the DNR Forest Modeler for potential use in refining growth models.
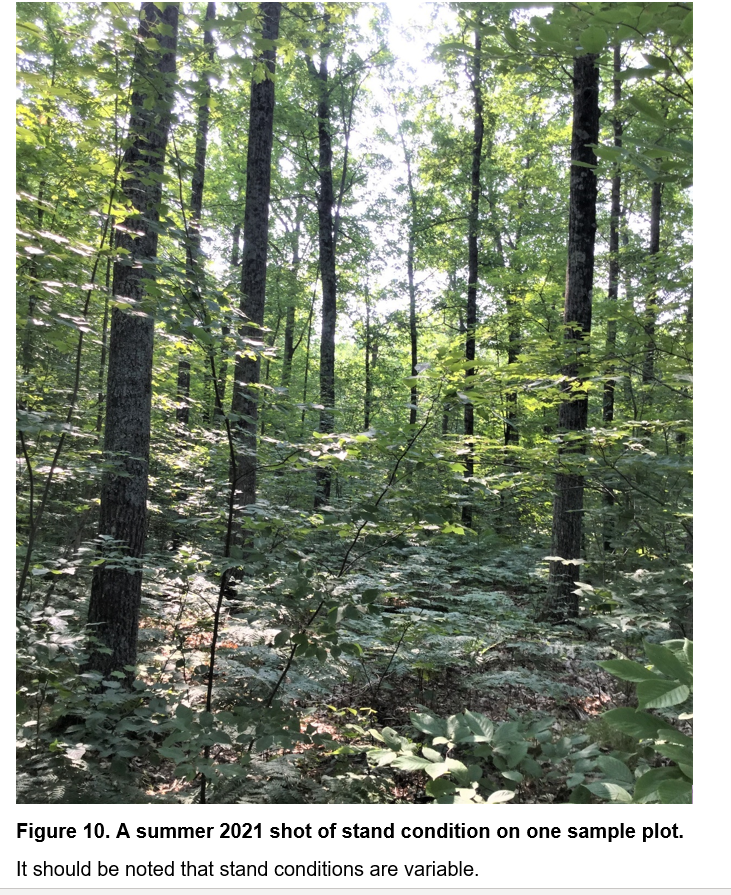
Figure 10: A summer 2021 shot of stand condition on one sample plot. It should be noted that stand conditions are variable.