
44.665304, -92.731634
Overview
This case study is a review of over 35 years of regeneration efforts on 83 acres of lowland hardwoods in the Mississippi/Vermillion River floodplain system in southeastern Minnesota. Over the years, clearcut with reserves and large and small gap silvicultural systems and natural and artificial regeneration efforts were all employed in the study area.
One important facet of the study is that there has been some patchy regeneration of silver maple since the initial harvest and regeneration efforts over 35 years ago. A key question we wanted to examine: Why did silver maple regeneration get established in some locations, but not on other portions of the site?
We gathered standard data on tree species, numbers, size and presence to assess forest condition in 2020. Sample plots were taken on a systematic grid across the site.
We also gathered data on three additional factors to see if we could learn anything about their impacts to regeneration success on lowland hardwoods sites:
- Reed canarygrass cover
- Soils
- Elevation in 1 foot contour intervals
Background
Much of the lowland hardwood forest acreage in the Mississippi/Vermillion/Cannon Rivers floodplain system is reaching biological maturity, and is in need of active management to maintain forested condition. Yet it has proven very challenging to consistently regenerate lowland hardwoods on these sites.
Two major challenges to successful regeneration of this area have been identified:
- Regular flooding inundation during the growing season most years. While there is excellent natural establishment of desirable seedlings (largely silver maple) in the spring and early summer of most years, they have been killed by almost annual growing season flooding inundation of a month or more. According to the U.S. Forest Service publication “Silvics of North America”, silver maple seedlings survived 60 days of continuously saturated soils but seedlings of low vigor died after only 2 days of complete inundation. https://www.srs.fs.usda.gov/pubs/misc/ag_654/volume_2/acer/saccharinum.htm
- Heavy reed canarygrass competition in some of the more open areas. Thick patches of Reed Canarygrass provide extreme competition for moisture, light and nutrients, choking out most other vegetation.
Bottomland Hardwoods Stand Data
River or stream name: Vermillion River
River or stream type: Minor river or upper reaches of major river
Floodplain or terrace: Floodplain
Floodplain topographic position: Bottom
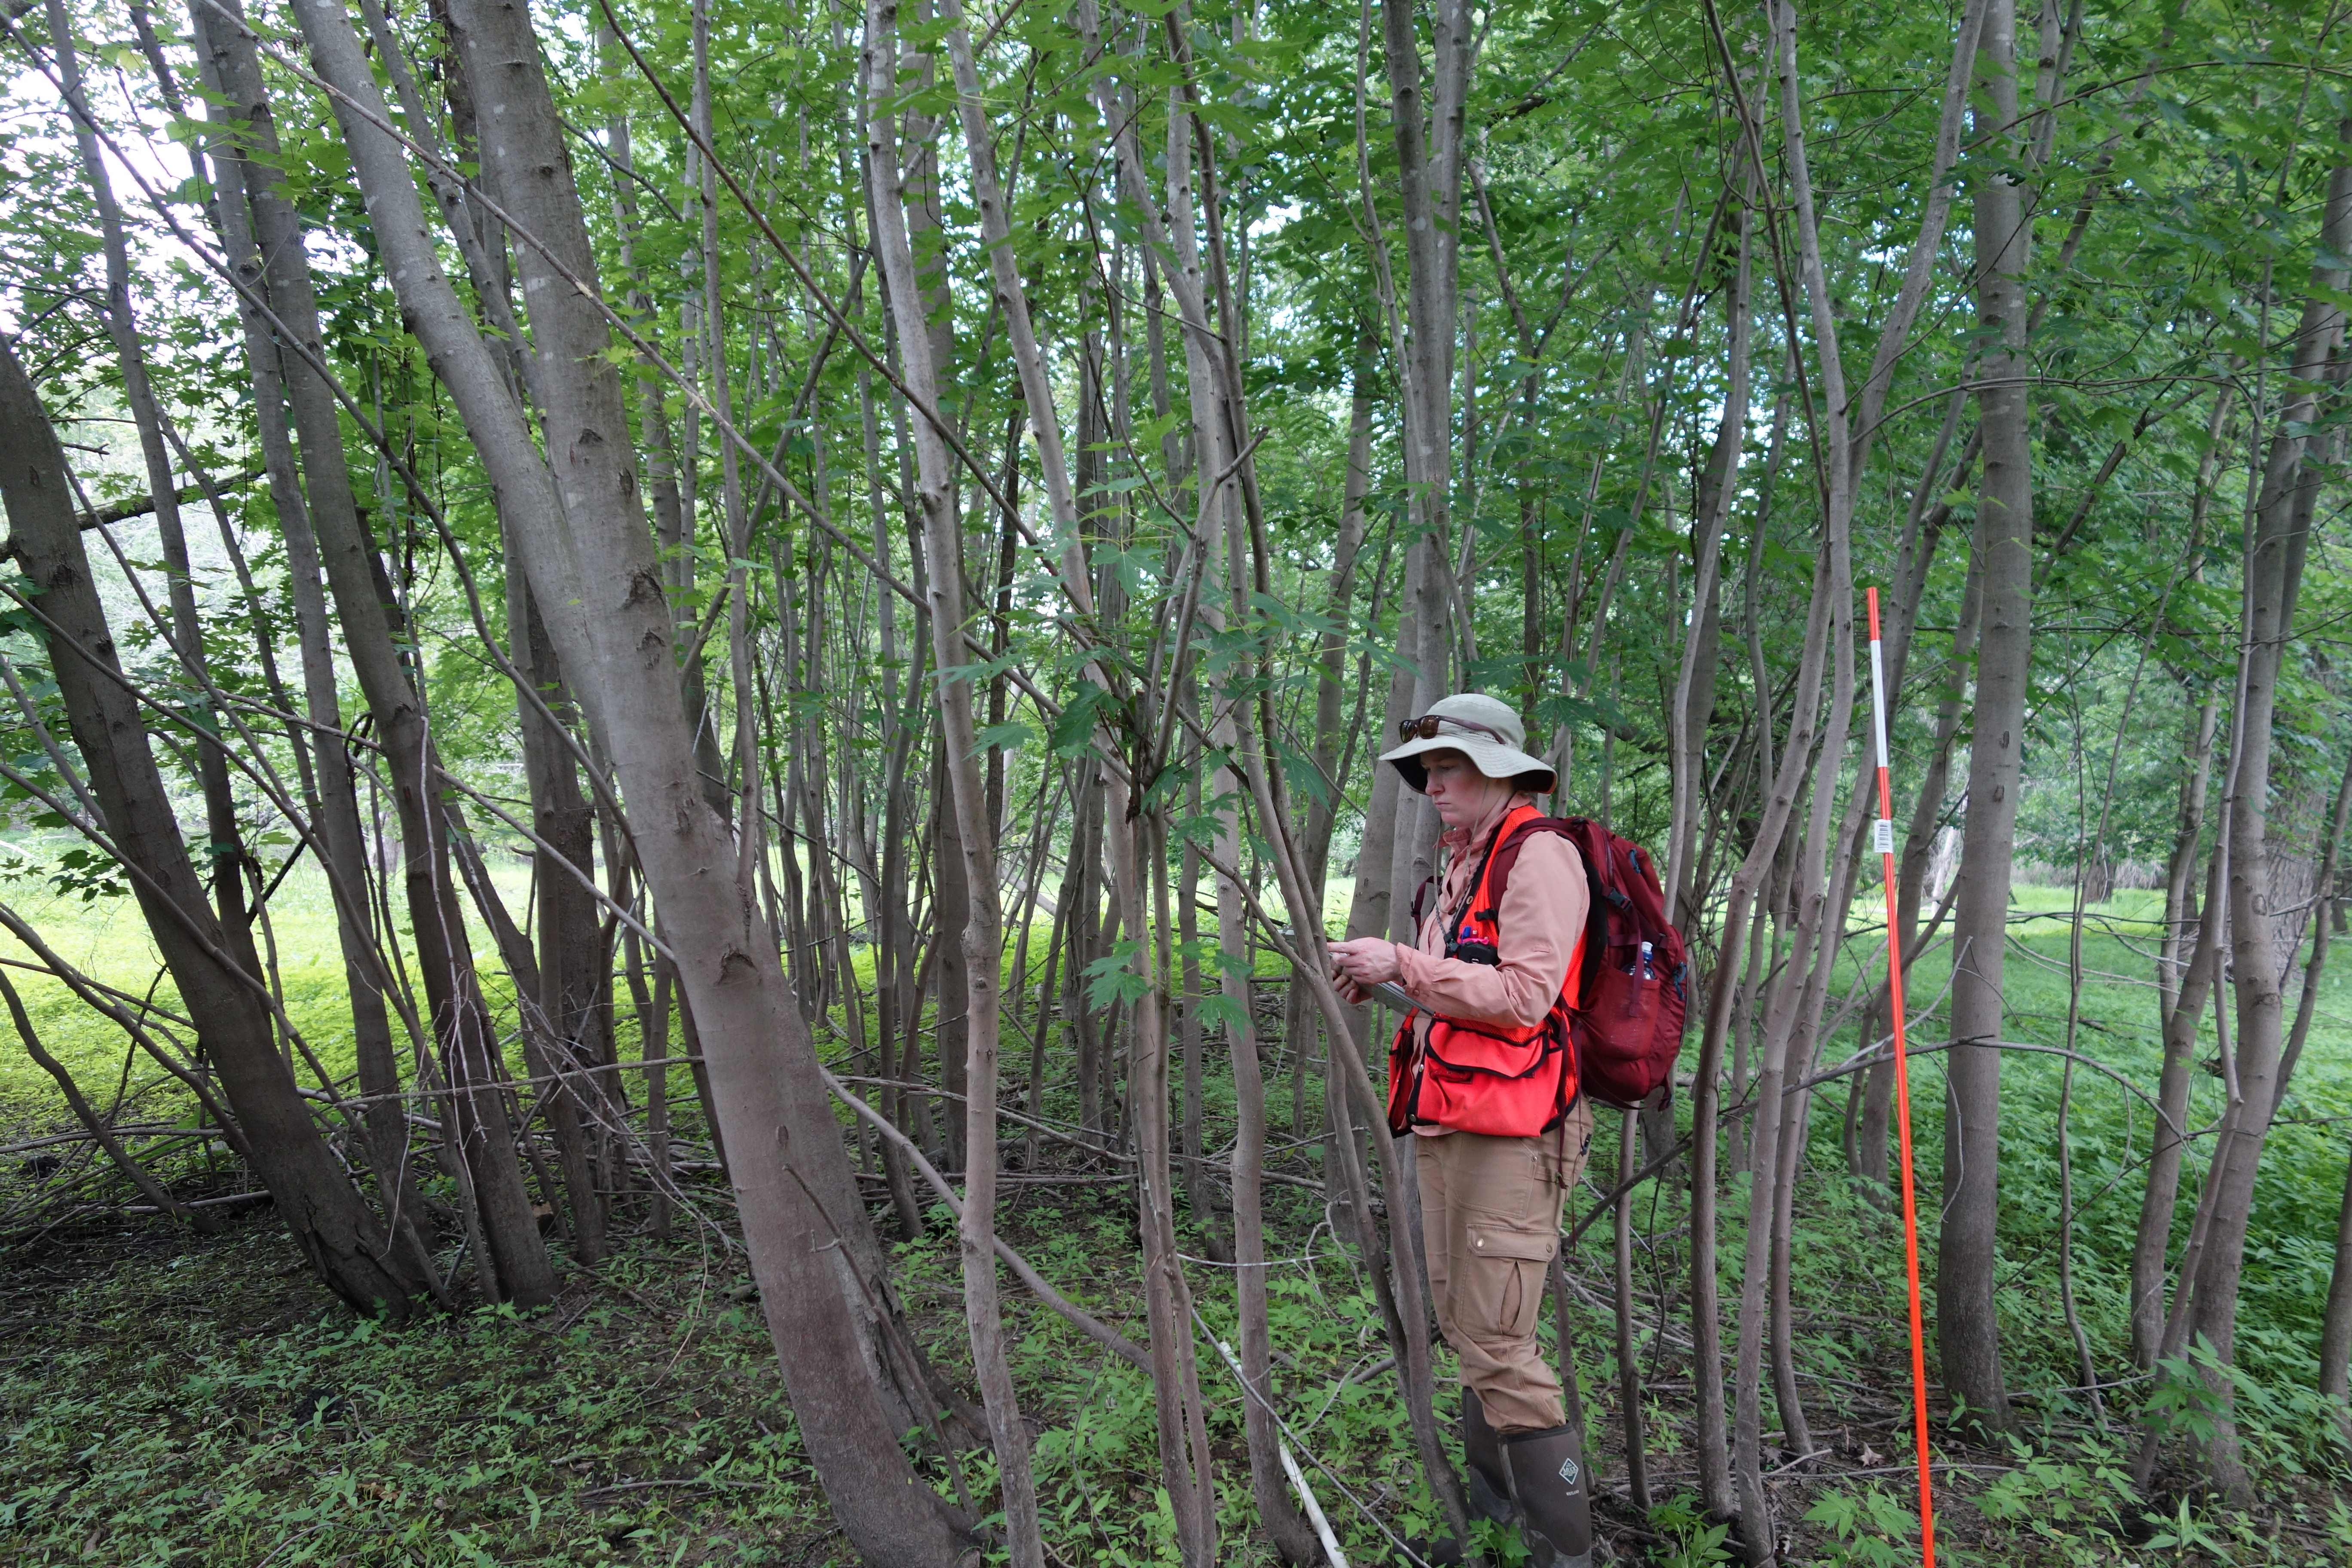
Figure 1: Inventorying a silver maple regeneration patch.
Silviculture Objective(s)
- Maintain floodplain forest for habitat, ecological services and economic benefits
- Regenerate mature portions of the stand to young forest of similar composition
- Improve the health and vigor younger portions of the stand
- Maintain or improve timber quality and value
Pre-treatment stand description and condition
Stand establishment and management history:
This study area is located entirely in the floodplain of the Vermillion River. Pre-harvest condition was a mixture of floodplain forest of variable density, open sections with no trees, and some marshy inclusions. The stands had a history of use as pasture prior to the state obtaining the property in the early 1980s. The wettest portions of the area (around 10 to 12 acres) appear to have been open marsh.
Pre-treatment species composition:
From timber sale appraisal records, forester recollections and remnant vegetation, we know that silver maple, green ash and cottonwood were the dominant overstory species prior to 1983. Green ash was present throughout, but seems to have been most prevalent in the section nearest the Vermillion River. The stand also contained small components of American elm and black willow.
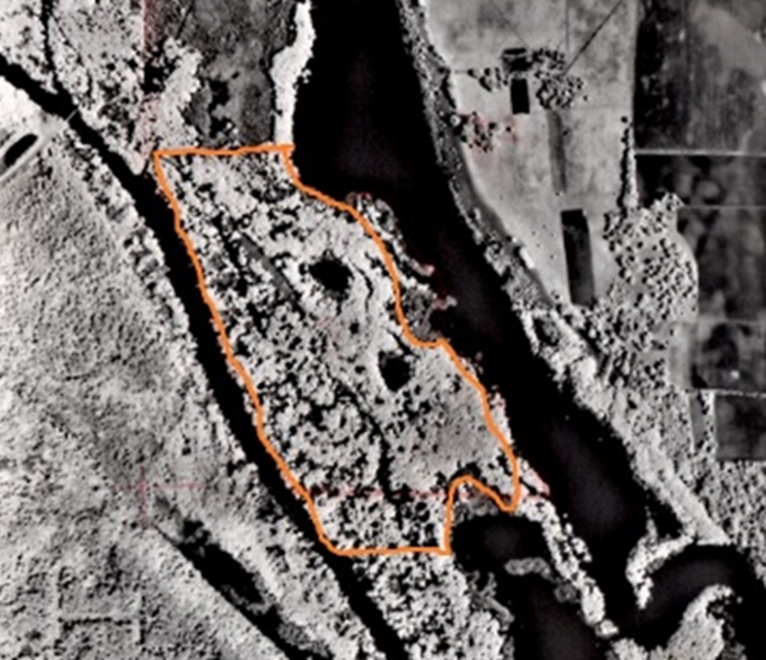
Figure 2: 1979 pre-treatment black and white aerial photo of study site and surrounding area.
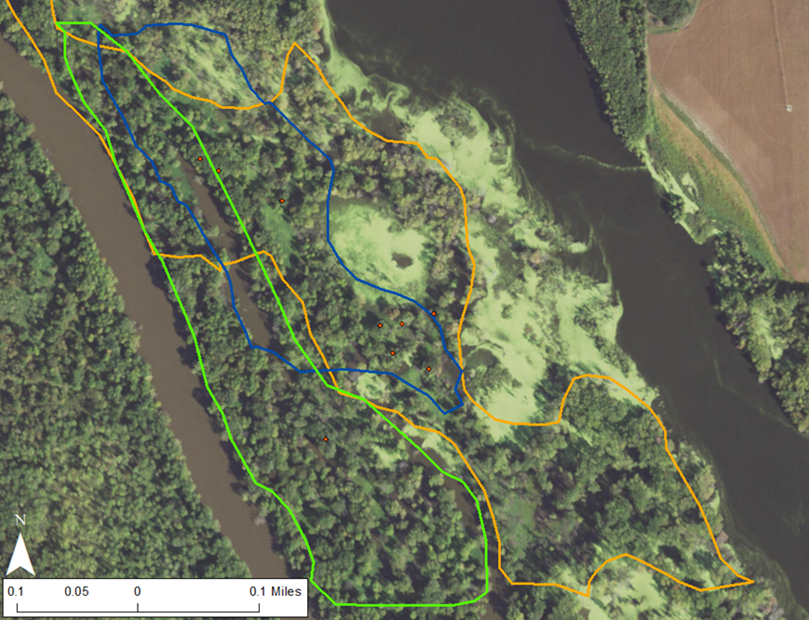
Figure 3: 2019 color aerial photo showing approximate boundaries of 3 harvests since 1983.
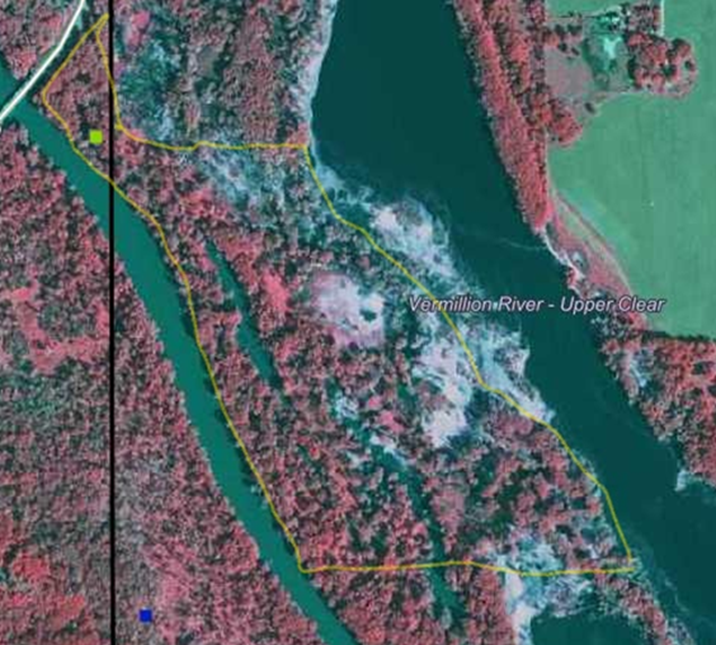
Figure 4: 2019 color IR aerial photo of study site showing overstory variability.
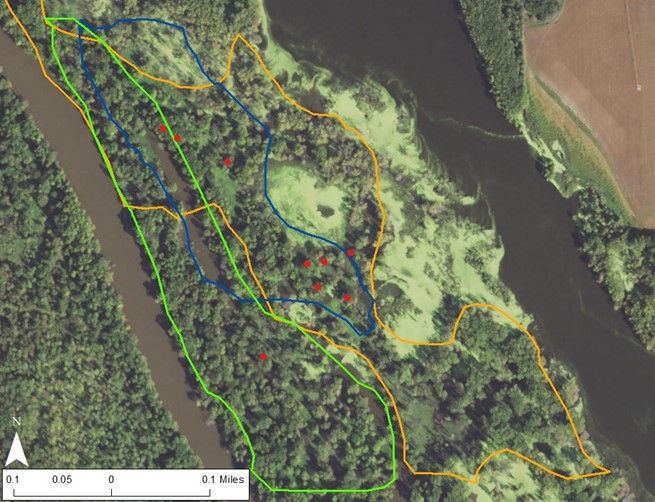
Figure 5: 2019 color aerial photo with red dots indicating location of 9 silver maple regeneration patches.
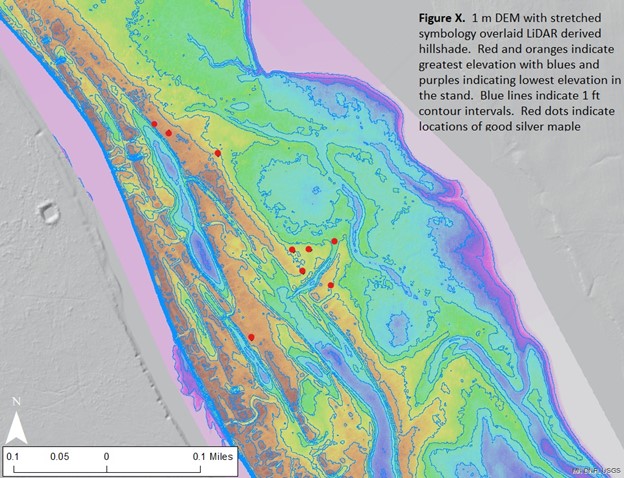
Figure 6: Color digital elevation model (DEM) imagery of study site with location of 9 regeneration patches.
Table 1: Summary of 1983 timber sale appraisals of sawlog volume (Board Feet) of merchantable trees with stems > than 12 inches DBH on 83 acres
Species Board Feet
Silver Maple 327,000
Green Ash 113,000
Cottonwood 10,000
American Elm 7,000
Black Willow 500
Pre-treatment forest health issues:
Emerald ash borer: The emerald ash borer was not yet established on the site as of 2018, but its imminent arrival was a major factor in the design and timing of the most recent harvest and regeneration activities from 2016 to 2019. Major objectives for that harvest and planting work were to salvage ash volume, and implement a regeneration plan to establish non-ash species.
Dutch elm disease: Elm is easily established on these types of sites but is killed by Dutch elm disease, usually before it reaches 8 inches diameter at breast height (DBH.
Landowner objectives/situation:
While specific objectives vary from parcel to parcel, lands under the administration of DNR-Forestry are managed in alignment with Section Forest Resource Management Plans (SFRMP) to ensure that state forest management activities meet statewide goals for ecological protection, wildlife habitat, timber production, and cultural/recreational values. The DNR assembles teams from the Divisions of Forestry, Fish & Wildlife, and Ecological & Water Resources who work with partners and the public to develop SFRMPs.
Specific objectives for this site and surrounding area are excerpted from the document “Blufflands/Rochester Plateau Subsection Forest Resource Management Planning ADDENDUM: Vermillion Bottoms and Lower Cannon River Area High Biodiversity Area Management Plan – December 2002”: Maintain and regenerate native plant communities and the plant and animal species that reside in the area. The intent is to have timber age classes spatially distributed to provide habitat both now and in the future for adapted flora and fauna to survive in this area. Processes that mimic the disturbances that helped to establish and maintain these communities will be used to achieve this goal.
The goals of biodiversity protection, timber management, recreation, and wildlife management will all be included in management decisions to achieve this goal. As new research or management techniques become available, they may be incorporated into management practices prescribed in this plan to achieve the long-range goals.
Silviculture Prescription
The following series of treatments were implemented:
| Treatment | Date | Description | Acres Treated |
| Planting | 1982 | Pre-harvest hand underplanting of green ash seedlings. Planting density unknown. | Approximately 83 |
| Partial harvest | Fall/Winter 1983/84 | Harvest to release understory and encourage further regeneration. Residuals left partly as seed trees to aid in regeneration. | 35 |
| Underplanting | Fall 1989 | 2500 silver maple, 1000 green ash and 800 black walnut seedlings hand underplanted prior to harvest operations | 23 |
| Clearcut with reserves harvest | Winter 1989/90 | Harvest to release regeneration. | 23 |
| Post-sale killing of competing undesirable trees | Growing season, 1990 | Kill the few competing boxelder and elm trees by girdling and applying herbicide to girdle wound. | 23 |
| Underplanting | 2016 | Planted 8,200 silver maple, 4,000 river birch, 4,000 swamp white oak, 3,500 hackberry, 4,200 cottonwood. | 22 |
| Seed tree with reserves harvest | 2019 | Seed tree with reserves harvest in 2019 to salvage ash before EAB mortality and to open up the site for regeneration. The timber sale boundary encompassed greater than 22 acres, but around 22 acres actually had harvest activity on it. | 22 |
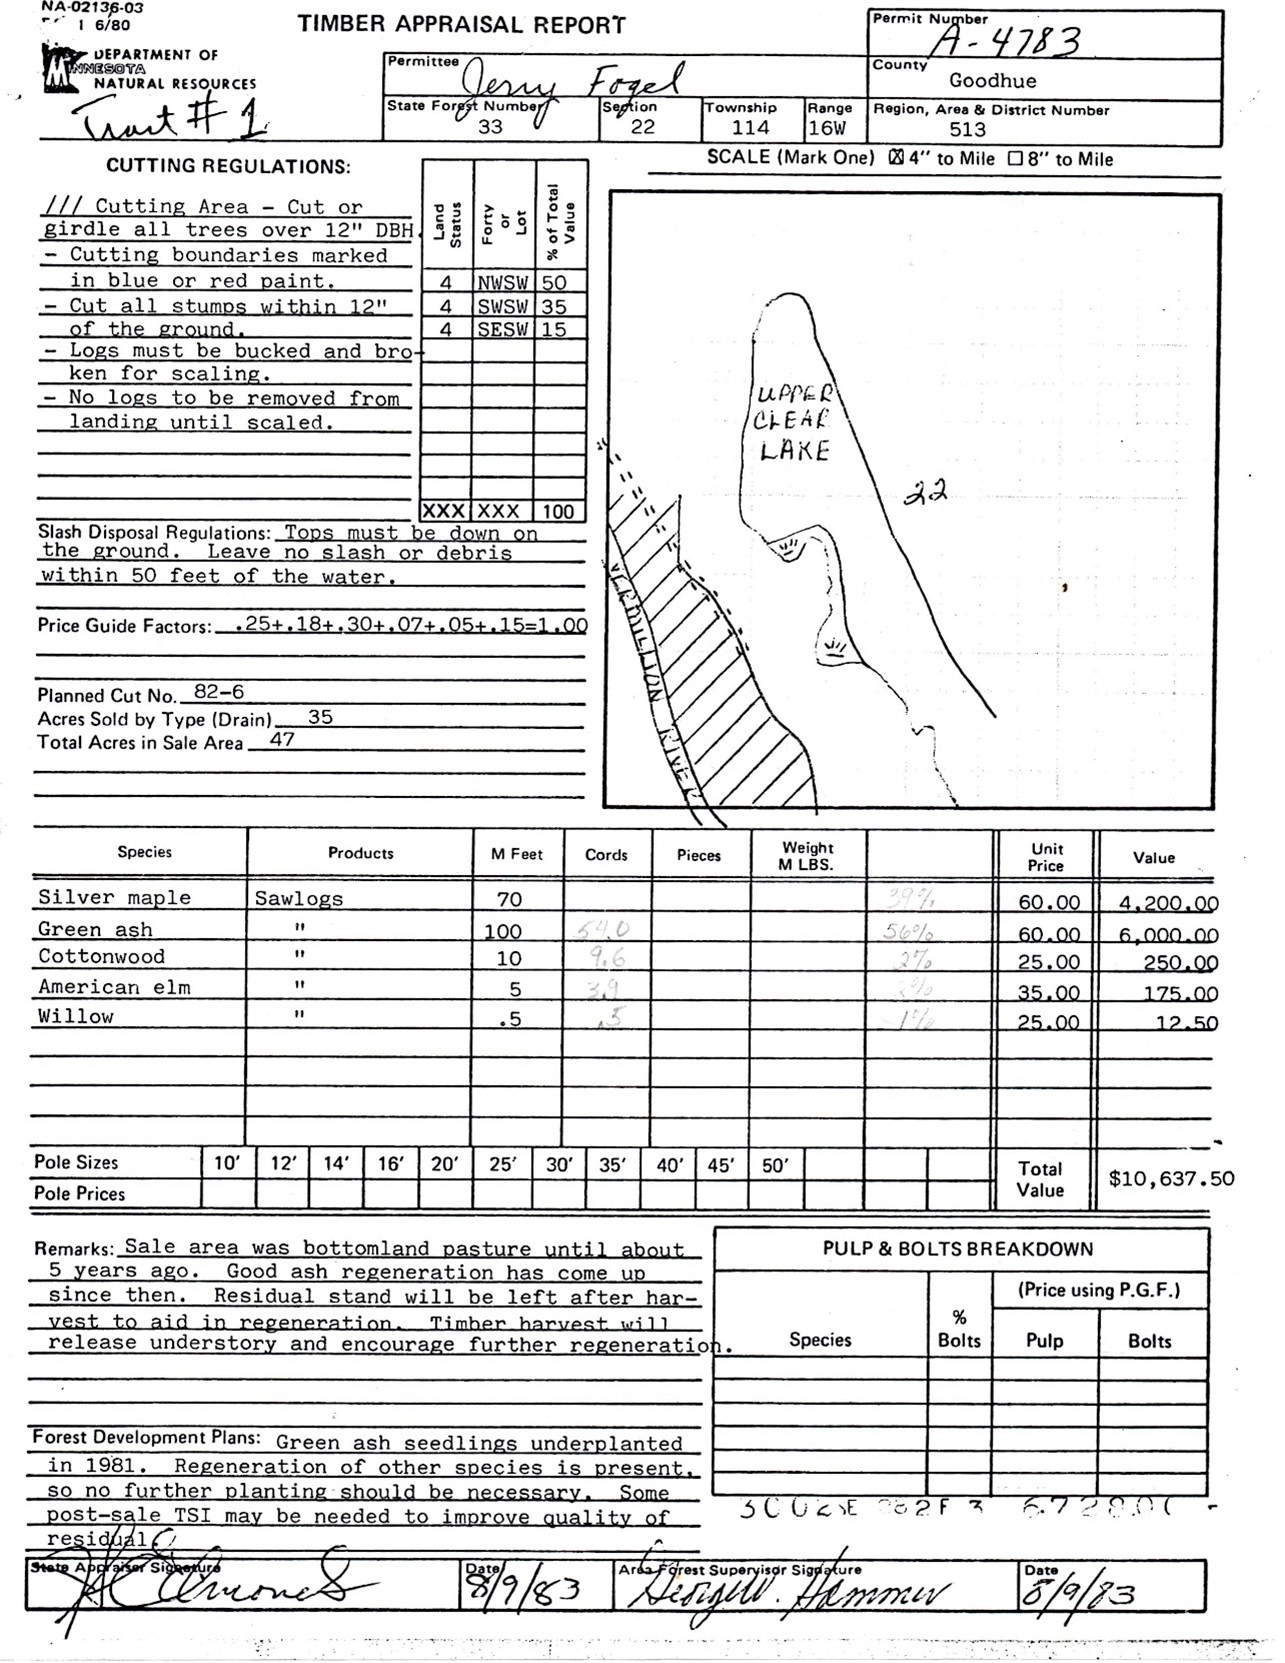
Figure 7: 1983 timber appraisal
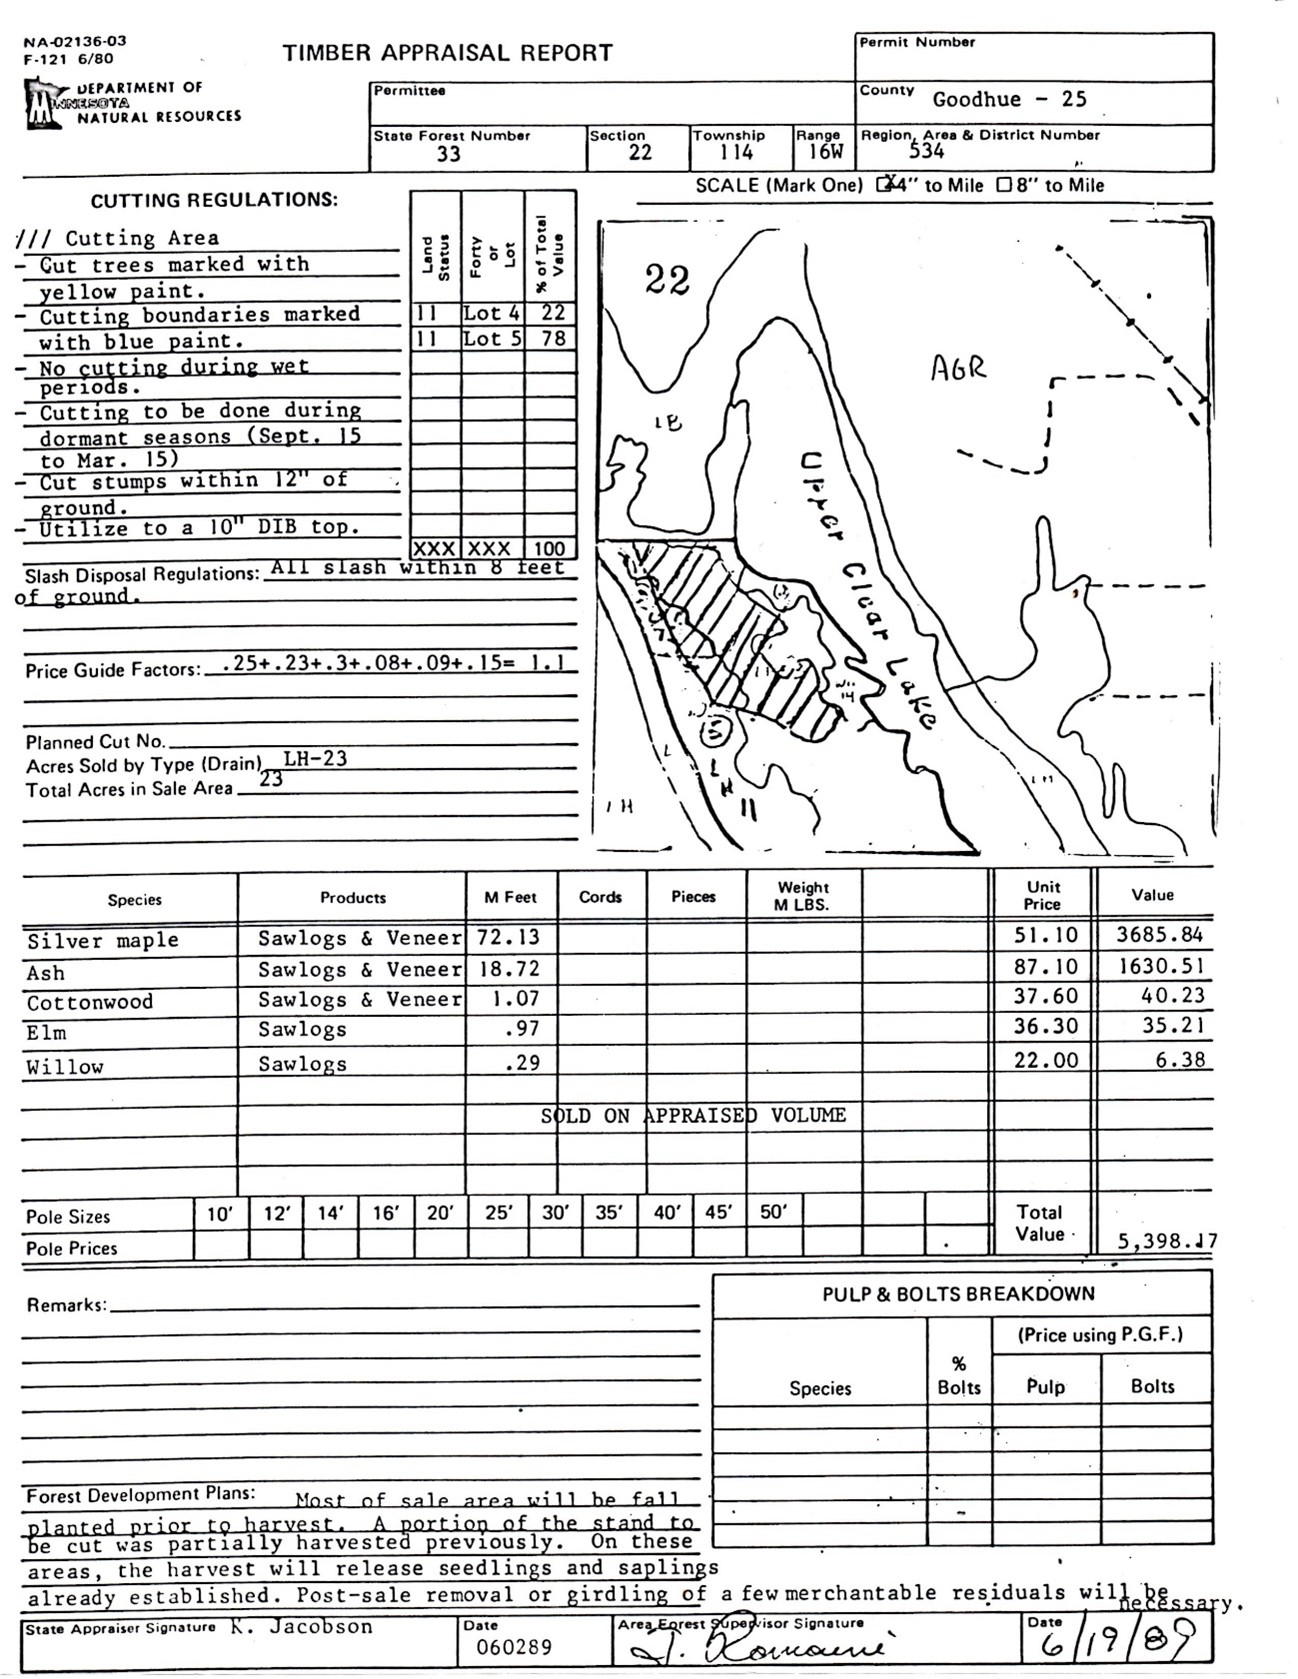
Figure 8: 1989 timber appraisal
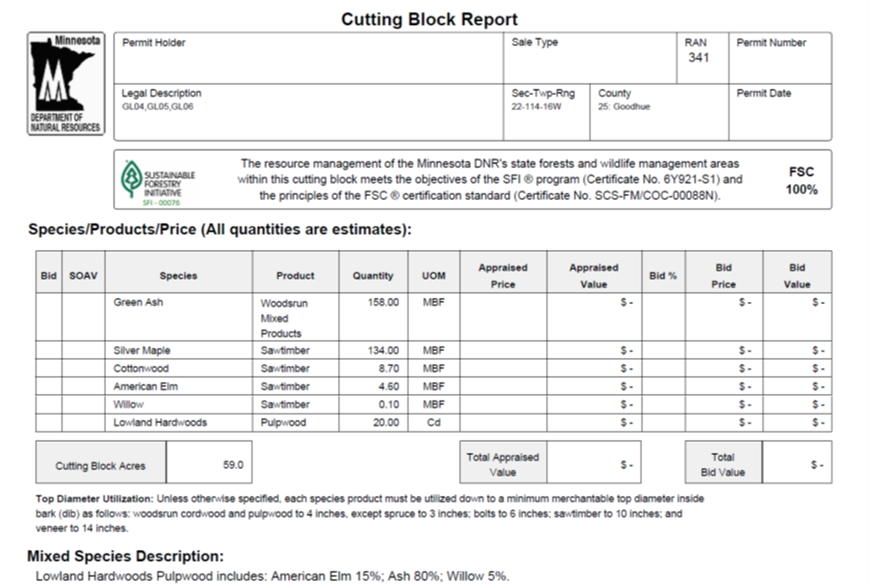
Figure 9: 2019 timber volume appraisal
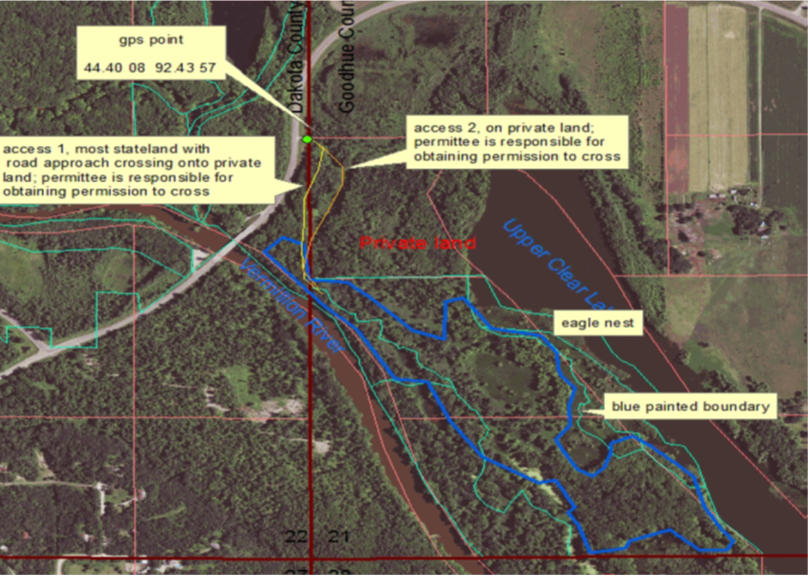
Figure 10: 2019 timber sale map
What actually happened during the treatment
Mostly as described above, with a few changes and adjustments as noted below:
- In 1983/84, a partial harvest was planned on 83 total acres, but only 35 acres ended up getting cut due to a default on the remaining sale acreage by the logger.
- The timber sale boundary for the 2019 seed tree with reserves harvest encompassed greater than 22 acres, but only around the 22 acres furthest south actually had harvest activity.
Post-treatment assessment
Overstory
Several lowland hardwood species are present in the overstory, with silver maple predominant
As shown in Table 2, silver maple is the predominant overstory species present, followed by green ash, elm, with minor presence of hackberry, black willow and boxelder.
Table 2: Tree species relative dominance of stems > 5” DBH on 10 factor BA plots in 2020
| Species | Species Relative dominance (%) |
| Silver maple | 57.9 % |
| Green ash | 26.2% |
| Elm | 11.2% |
| Hackberry | 1.9% |
| Black willow | 1.9% |
| Boxelder | 0.9% |
| Total | 100% |
Forest cover densities and sizes are variable
In 2020, basal area plots indicate an overall average basal area of 48.6 ft2, but the abundance, structure and age of tree cover was quite variable. Some areas have full tree cover, with only scattered cover on other portions of the site. In some of the marshiest portions, there is no tree cover at all.
Table 3: Tree basal area (feet2/acre)/ and frequency on 10 factor BA plots (%) by species and diameter class in 2020
| Diameter Class | ||||
| Species | 5" to 10" DBH | 10" to 15" DBH | 15" to 20" DBH | > 20" DBH |
| Silver Maple | 0.4/5% | 1.8/14% | 2.7/18% | 23.2/68% |
| Green Ash | 8.2/32% | 1.8/18% | 1.4/14% | 1.4/9% |
| Elm | 2.3/14% | 0.5/5% | 1.8/14% | 0.9/9% |
| Hackberry | 0.0/0% | 0.5/5% | 0.5/5% | 0.0/0% |
| Black Willow | 0.0/0% | 0.0/0% | 0.5/5% | 0.5/5% |
| Boxelder | 0.5/5% | 0.0/0% | 0.0/0% | 0.0/0% |
| Total BA: 48.6 |
Note on distinguishing between harvest residuals vs. trees regenerated post-harvest:
As can be seen in table 2 above and table 3 below, the site contains a range of tree sizes. Some are harvest residuals, and some have regenerated after harvest activity. As a way to distinguish which trees probably originated post-harvest, we collected tree data by diameter class. We estimate that the vast majority of trees from 5” to 10” DBH have originated since the initial harvest activity. The large majority of trees over 15” DBH are likely harvest residuals. The 10 to 15” DBH size category likely contains a mixture of harvest residuals and stems regenerated post-harvest.
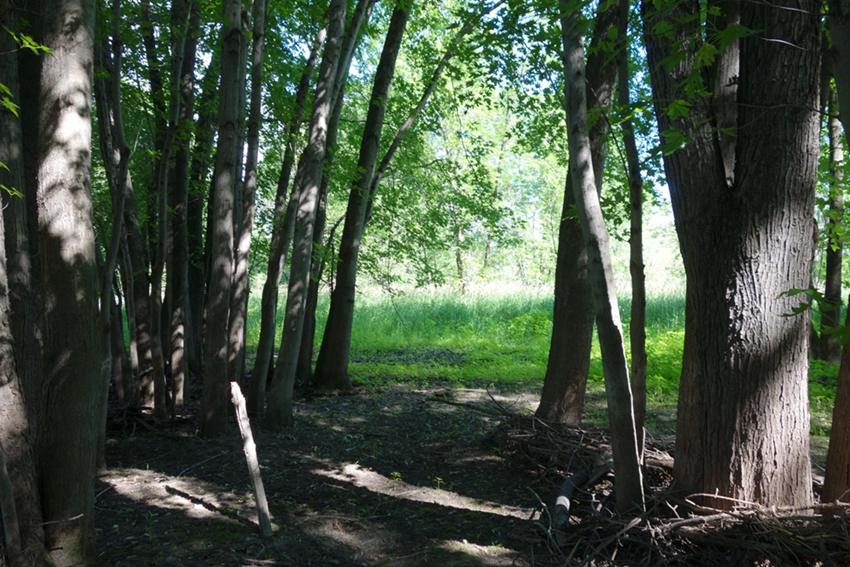
Figure 11: A patch of 20 to 35 year old silver maple in late June 2020
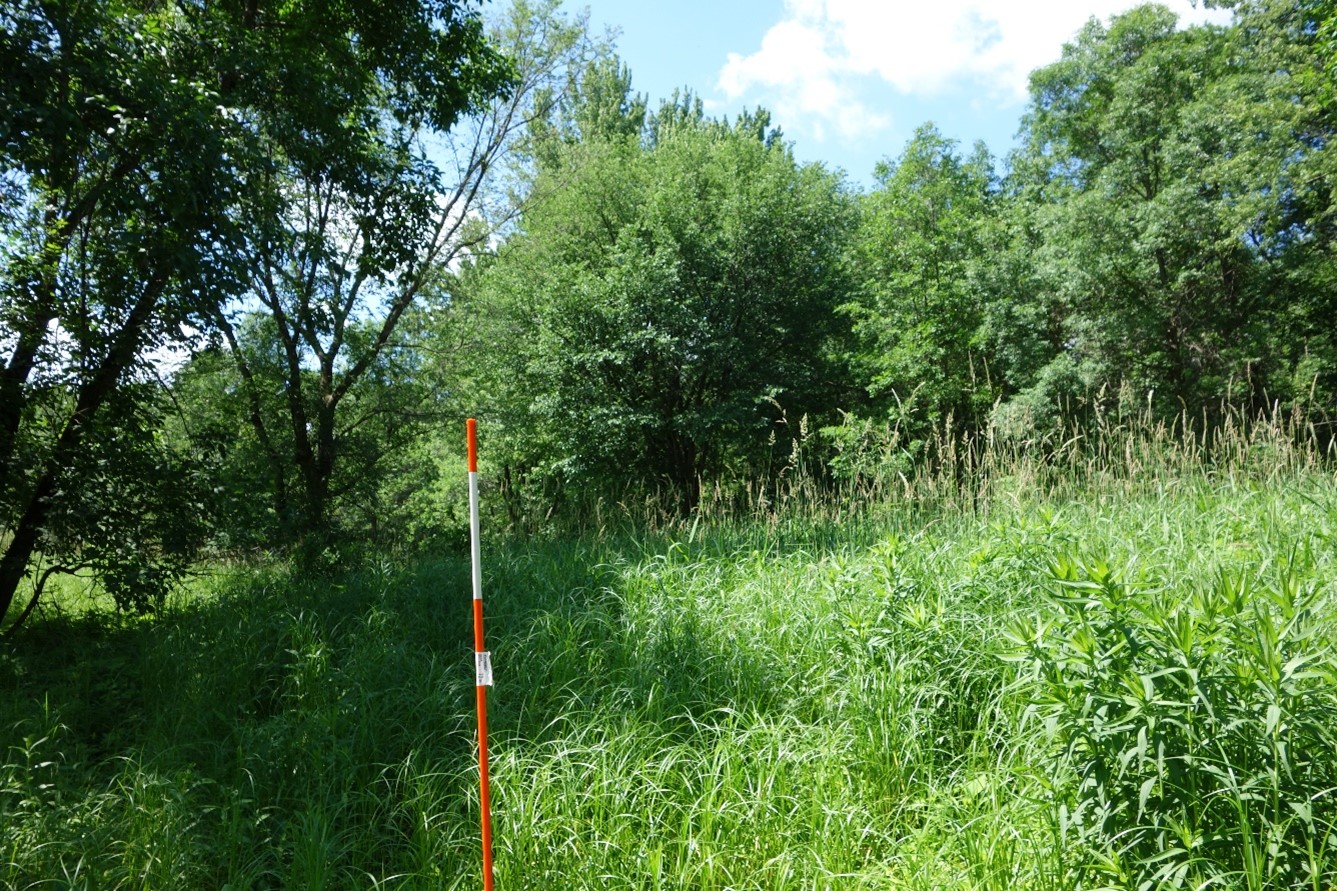
Figure 12:A June 2020 photo showing variable site conditions: reed canarygrass, sedges, and scattered tree cover.
Regeneration
Regeneration has been inconsistent, and as of 2020 most of the site is not yet adequately reforested
On approximately the westernmost 1/3 of the site nearest the Vermillion River, green ash and American elm regeneration has been adequate. Unfortunately Dutch elm disease and emerald ash borer impacts mean that neither of those species is a solution to achieving long-term forested site condition anymore.
On the remainder of the site, there are a very few scattered silver maple, green ash, American elm, boxelder and hackberry that have regenerated post-harvest, as well as at least nine small patches of excellent silver maple regeneration with stems from 1” to 15“ DBH in size in 2020.
There were silver maple regenerants (less than 1 foot in height) on 59% of our plots. Clearly, the vast majority of seedlings of this small size have tended to become established in the spring/ early summer of each year, and then get flooded and killed before reaching larger size classes. There were very few stems of regeneration of any species from 1 foot in height to 5 inches DBH.
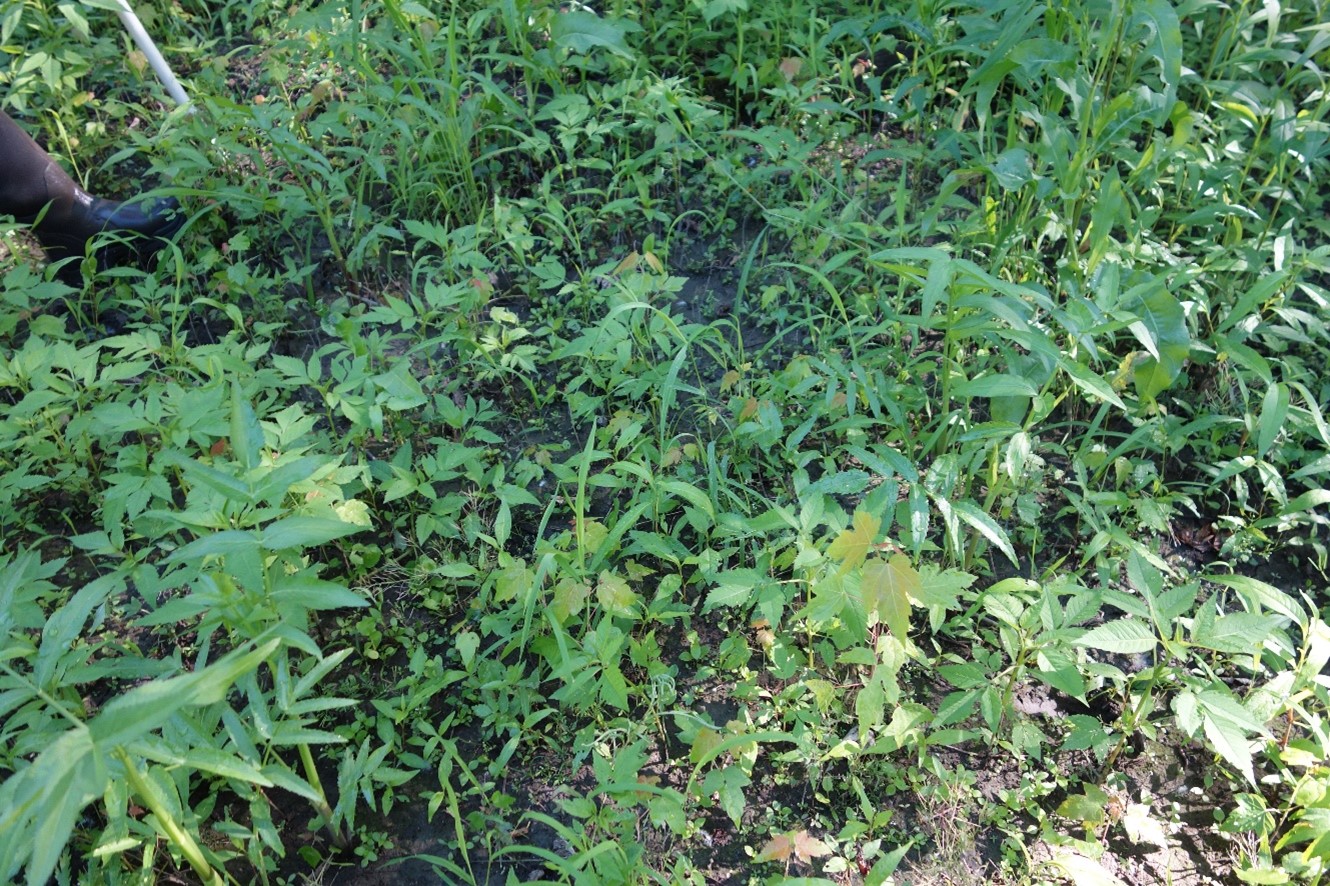
Figure 13: June 2020 photo showing a few small silver maple regenerants amongst competing vegetation.
Table 4: Stems/acre/ and plot frequency of trees regenerated post-harvest* by species and size class in 2020
Frequency (Freq) = % of plots with occurrence.
| Size Class | ||||||
| Species | < 1 foot in height (stems/acre/% plot freq.) | >1 foot in height and < 1”DBH (stems/acre/% plot freq.) | > 1” DBH and < 3” DBH (stems/acre/%plot freq.) | 3” to 5” DBH (stems/acre/% plot freq.) | 5”-10” DBH (BA - Ft2/acre/% plot freq.) | 10”-15” DBH (BA - Ft2/acre/ % plot freq.) |
| Silver Maple | NA/59% | NA/0% | 0/0% | 0/0% | 0.5/5% | 0.2/14% |
| Green Ash | NA/0% | NA/5% | 0/0% | 5/5% | 8.2/32% | 1.8/18% |
| Elm | NA/0% | NA/5% | 0/0% | 0/0% | 2.3/14% | 0.5/5% |
| Hackberry | NA/0% | NA/0% | 0/0% | 0/0% | 0/0% | 0.5/5% |
| Boxelder | NA/0% | NA/0% | 0/0% | 0/0% | 0.5/5% | 0/0% |
| Totals | 0/NA | 5/NA | 11.5/NA | 3.0/NA |
*The 10” to 15” DBH size class contains a mix of harvest residuals and trees regenerated post-harvest.
Notes on regeneration data:
- Because young silver maple regenerants less than 1 foot in height (“regenerants”) become established easily but have routinely been killed by flooding within a year or two of establishment, we did not invest time in gathering their exact numbers. We simply noted their presence or absence for each plot.
- Pre-2010 regenerationsurvey records are almost nonexistent for this site - an unfortunate consequence of MNDNR’s transition through 3 different silvicultural information storage systems over the past 35 years. The only pre-2010 regeneration data we could find for this site is a note in a file indicating that for the 23 acres planted in 1989, there were an average of 313 seedlings/ acre with average height of 2 feet in 1991. The note does not indicate the species, but they were probably a combination of silver maple and green ash. Therefore, we know that many of the seedlings planted in 1989 survived for at least two years.
Silver Maple Regeneration Patches
Notably, at least nine patches of silver maple have become established since the first documented harvest activity in 1984. A critical question for current and future regeneration efforts is this: Why did silver maple become successfully established in these patches, but not on most of the site? We looked at elevation, soils and reed canarygrass densities as three factors that may influence silver maple establishment.
None of the sample plots on our grid fell within these patches, so we took six additional plots directly in them. The patches vary in size from approximately ¼ to ½ acre. In addition to the plot data gathered for the six patches, we noted locations of three more with waypoints for a total of nine patch locations. In 2020, these patches contain trees ranging from approximately 1 to 20+ inches DBH.
Table 5: Tree density by species, size class and origin type (sprout or seedling) in six silver maple regeneration patches in 2020
| Species | 1 to 3” DBH – Seed (stems/Ac) | 1 to 3” DBH - Sprout (stems/Ac) | 3 to 5” DBH - Seed (stems/Ac) | 3 to 5” DBH - Sprout (stems/Ac) | 5-10” DBH (BA in Ft2/Ac) | 10-15” DBH (BA in Ft2/Ac) | 15-20” DBH (BA in Ft2/Ac) | 20” + DBH (BA in Ft2/Ac) |
| Silver maple | 3750 | 333 | 1750 | 417 | 43.3 | 36.7 | 20.0 | 8.3 |
| Green ash | 0 | 0 | 0 | 0 | 10.0 | 5.0 | 3.3 | 1.7 |
| A. elm | 0 | 0 | 0 | 0 | 0.0 | 3.3 | 0.0 | 0.0 |
The patches have become established at different times, but all since the first harvest activity in 1984. The table below shows field ring counts for one selected tree in 6 of the patches. Note: We counted rings on larger DBH than patch average for waypoints 204 and 205. Presumably, these trees were on the high end of ages for the patch. For the other four patches, we counted rings on trees that were closer to average DBH for the patch.
Table 6: Ages of Selected Silver Maple in Regeneration Patches in 2020
| Waypoint Number Location of Patch | Diameter at Breast Height (Inches) | Number of Rings in Tree Core |
| 204 | 16.5 | 35 |
| 205 | 12.2 | 32 |
| 216 | 8.9 | 19 |
| 218 | 4.9 | 14 |
| 219 | 3.8 | 11 |
| 226 | 5.4 | 13 |
| 227 | Data not gathered | Data not gathered |
| 228 | Data not gathered | Data not gathered |
| 230 | Data not gathered | Data not gathered |
Silver maple regeneration patches and elevation
Note: See figure 6 for Digital Elevation Model imagery of the site: https://silvlib.cfans.umn.edu/file/7551/download?token=iVnPbxD3
We looked at Lidar data to see if we could determine whether regeneration success might be related to elevation. Our hypothesis was that higher sites would be flooded for less time during the growing season, and would therefore be more likely to support tree regeneration survival and growth. Our data did show that on average, patches with well-established regeneration are on slightly higher ground. NOTE: Error estimates for the Lidar data are about 0.35 ft when compared with DNR ground points; and about 0.5 ft accuracy in forested areas fully covered by trees.
- Average elevation of plots in patches of post-harvest regeneration: 675.544 feet.
- Average elevation of all systematic grid plots: 675.377 feet.
However, some well-established regeneration such as at waypoints 218, 226, 227 and 228 is on relatively low areas, as shown in Table 6 below.
Table 7: Elevation of 9 patches of silver maple regeneration, and highest and lowest elevation recorded on all sample plots over the entire site
| Waypoint Number Location of Patch | Elevation (feet) |
| 204 | 676.745 |
| 205 | 676.761 |
| 216 | 676.431 |
| 218 | 674.804 |
| 219 | 675.151 |
| 226 | 673.372 |
| 227 | 674.541 |
| 228 | 674.832 |
| 230 | 676.019 |
| Highest elevation recorded on site | 677.799 |
| Lowest elevation recorded on site | 671.734 |
Another thought was that perhaps higher elevation relative to the area immediately adjacent to the patch was more influential than highest elevation over the entire large site. In other words, were the patches on an “island” of slightly higher ground than the area directly surrounding them? We were unable to discern a clear pattern to support that hypothesis. Neither field observations or Lidar imaging indicate a clear pattern of higher elevation in the patches with good regeneration as compared to the immediate surrounding area with little or no regeneration.
So while in general higher elevation seems better than lower for establishing silver maple, it is clear that silver maple regeneration success must be significantly affected by other factors.
Silver maple regeneration patches and soils
We took 3 soil cores to see if we could discern any obvious soil differences between locations of silver maple regeneration patches, and areas without established silver maple regeneration. NOTE: See figure 21 for the field notes for our three soil sample points.
We took one sample core in a location with no regeneration, and two cores in patches with abundant silver maple regeneration from 1” to 12” DBH.
There was some other modest variability between the samples, but we feel that three samples are just not enough for us to reach any conclusions that would explain different levels of regeneration success. A challenge that we ran into was that the higher than normal water table when we were out prevented a thorough look at a deeper profile - we were only able to look 2 to 3 feet down. We suggest that the potential impact of soils on silver maple regeneration success could be an excellent avenue for further research.
Silver maple regeneration and reed canarygrass competition
We estimated percentage of reed canarygrass cover for each of the 22 plots on our grid, gathered on June 24, 2020. We were surprised that reed canarygrass averaged only 9.4% of total cover, and that 14 of our plots had 1% or less. There are clearly a few places with heavy reed canarygrass cover, but for the most part the levels we observed indicate that in 2020 it is not a major impediment to tree establishment on most of this site.
Ground Cover
Ground cover was consistent with that commonly found in MHs68 plant communities. https://www.dnr.state.mn.us/forestry/ecs_silv/npc/ffs68.html#community-description
2022 Update
What could be causing differences in regeneration success?
As documented in several other case studies, success in achieving silver maple regeneration and recruitment to larger size classes was highly variable. There were patches of successful regeneration and recruitment, but also significant portions of each site with little to no recruitment of silver maple regeneration.
We looked at variables that might help explain the differences in regeneration success, including different silvicultural treatments, elevation, and level of reed canary grass competition. None of those factors consistently explained regeneration success differences.
We took more soil samples to examine the possibility that soils could be a factor
We also postulated that one of the reasons for the inconsistent recruitment success might be differences in soils. We had taken 3 soil samples on this Flynnville site in 2019 – 2 from areas with good silver maple regeneration and 1 from an area with no silver maple regeneration. Results were inconclusive. There were some minor differences between the samples, but nothing significant enough that we felt could impact regeneration and recruitment success. We felt that perhaps more samples would help clarify whether we could identify discernable regeneration success differences due to soils.
We took 1 more soil sample in June of 2022.
We found minor soil variability, but nothing that we felt could help explain differences in regeneration success.
We were interested in any differences that might help explain regeneration variability. We were especially interested to see if we could find a significant layer of sand within the first 5 feet of the profile that might help explain patches of regeneration success due to being a more hospitable medium for seedling establishment and early growth due to better drainage. There was a small amount of surface sand at sample 3, but it did not seem like it was nearly enough to have had a significant impact.
There was some other modest variability between the samples, but none that we feel would help explain different levels of regeneration success. See Table 2022-1 and Figures 2022-1 thru 2022-3.
Table 2022-1: Field notes from the 3 original soil samples taken in 2019 on the Flynnville site
Notes for Three Soil Sample Points Taken in 2019 | |||||||
Sample #1 |
| Sample #2 |
| Sample #3 | |||
Tree Cover Description: | Small grove of 1" to 8" DBH silver maple trees in a slight depression |
| Tree Cover Description: | No trees |
| Tree Cover Description: | Patch of 3" to 12" DBH silver maple trees |
GPS Point: | 521645; 4945431 |
| GPS Point: | 521431; 4945647 |
| GPS Point: | 521402; 4945659 |
Profile |
| Profile |
| Profile | |||
Depth | Soil Texture |
| Depth | Soil Texture |
| Depth | Soil Texture |
0" to 7" | Silty Clay Loam |
| 0" to 11" | Silty Clay Loam |
| Surface | Sand |
7" to 13" | Silty Clay Loam |
| 11" to 29" | Silty Clay |
| 0" to 4" | Loam |
13" to 24" | Silty Clay |
| 29" to 36" | Silty Clay |
| 4" to 18" | Silty Clay Loam |
|
|
| 18" to 33" | Silty Clay | |||
|
|
|
|
|
| 33" to 40" | Wet Silty Clay |
Notes: | Water trickled in after hole dug to 24". |
| Notes: | Soil is very wet after 29". Water table at 36". |
| Notes: | Water table at 40" |
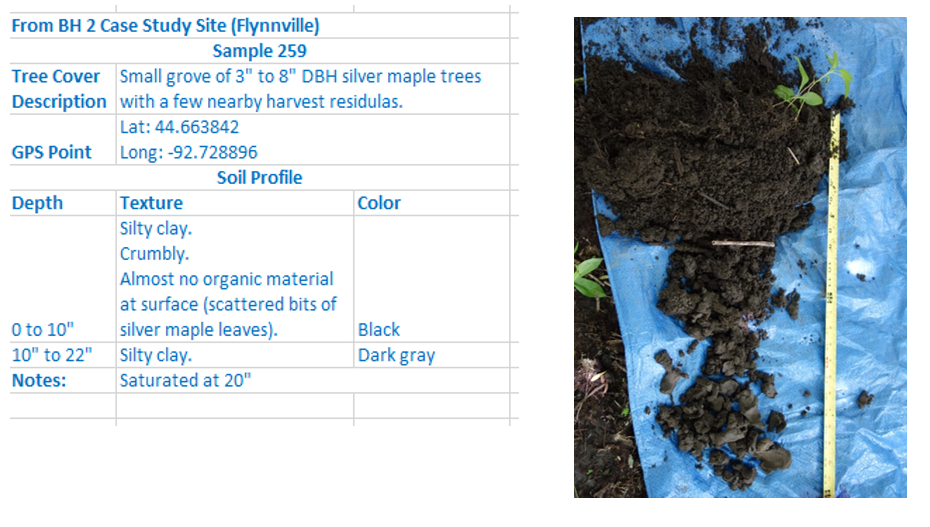
Figure 2022-1: Soil notes and sample photo from the Flynnville site
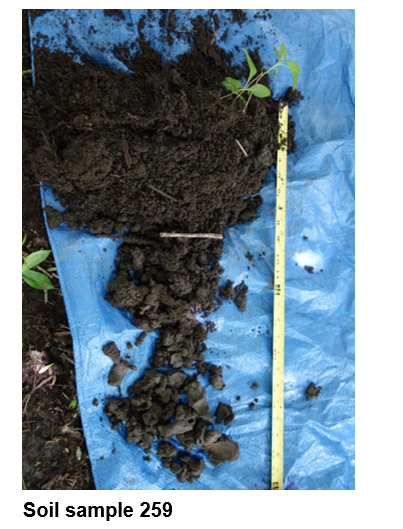
Figure 2022-2: Soil sample 259 from the Flynnville site, collected in 2022
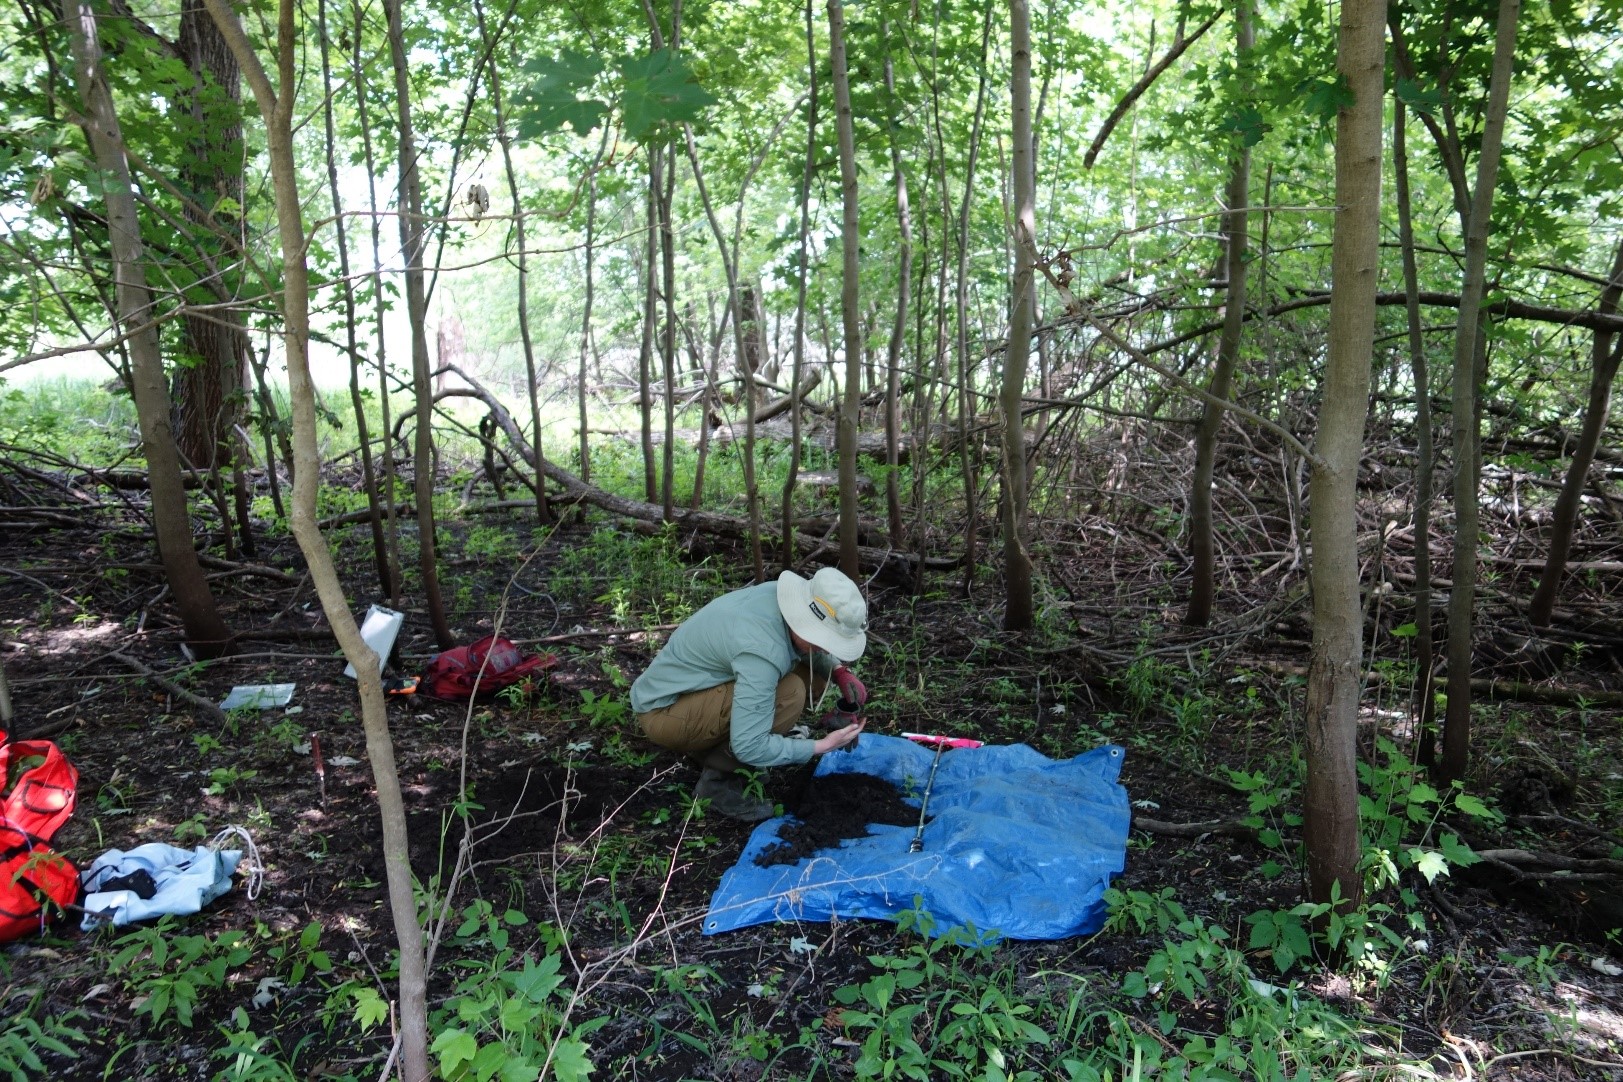
Figure 2022-3: Conditions on the Flynnville site at sample plot 259 of young forest with excellent silver maple regeneration
Plans for future treatments
In October 2021, about 3.5 acres of this site were planted with large containerized tree seedlings, called “RPM” trees. RPM stands for Root Production Method, which is a patented air root pruning method. The DNR has done other small scale projects planting RPM trees on floodplain forest sites in the region and has found that so far, these trees have shown promise at growing in flood-prone sites. We hope to report on our results at this site with these special trees at a later date. The cost per tree is so far about $32, which includes the cost of the tree, freight, planting, and vole guards. DNR plans to continue planting RPM seedlings on sections of this site over time, if they continue to show promise, and as permitted by funding.
The stand will continue to be monitored through regular regeneration surveys until seedlings reach the stage where they can survive annual flooding inundation and are “free to grow”.
The serious regeneration challenges in the Vermillion/Mississippi River floodplains will require an adaptive approach that allows incorporation of new information, and flexibility to conduct trials with unique approaches.
Costs and economic considerations
Costs
Hand underplant seedlings on 83 acres in 1981: $ 52/ac. 1981 dollars
Timber sale setup and administration on 35 acres in 1983/84: $ 50/ac. 1983/84 dollars
Hand underplant seedings on 23 acres in 1989: $ 53/ac. 1989 dollars
Timber sale setup and administration on 23 acres in 1989 : $ 75/ac. 1989 dollars
Post-sale killing of undesirable trees on 23 acres in 1990: $ 50/ac. 1990 dollars
Hand underplant seedlings on 22 acres in 2016: $190/ac. 2016 dollars
-----------
TOTAL Note: A per acre total across the entire site is not possible because not all acres were treated with each practice.
Revenue:
Partial harvest on 35 acres (1983): $316/ac. 1983 dollars
Clearcut with reserves harvest on 23 acres (1989): $235/ac. 1989 dollars
Seed tree with reserves harvest on 59 acres (2019) $665/ac. 2019 dollars
------------
TOTAL Note: A per acre total across the entire site is not possible due to not all acres being treated with each practice.
Other notes
We had help:
We gratefully acknowledge the valuable assistance of MNDNR Central Region Forest Health Specialist Brian Schwingle with climate data, MNDNR Silviculture Program Leader Mike Reinikainen and Ecological Classification System Program Coordinator Matt Huseby with review and editing, and Forestry Intern Amelia Knoll with data collection.
Climate Adaptation Considerations
Impacts of wetter climate:
The wetter climate of the last 35 years has resulted in a more challenging environment for regenerating Mississippi and Vermillion River floodplain forests. These areas have undoubtedly spent more time underwater during the growing season on average than in the decades preceding the 1980s. The year-round precipitation and growing season precipitation average is about 3 inches higher in the last 35 years than in the preceding 35 years This is not only true for Goodhue County, but collectively for all Minnesota’s Mississippi River Counties (Dakota, Goodhue Wabasha, Winona, and Houston) (Minnesota Climate Trends).
Summary / lessons learned / additional thoughts
There are mixed regeneration results as of 2020, 36 years after the initial harvest treatment.
1. As of 2020 most of the site is not yet adequately reforested, so monitoring and reforestation efforts will continue.
On approximately the westernmost 1/3 or so of the site nearest the Vermillion River, green ash and American elm regeneration has been adequate. Unfortunately Dutch elm disease and emerald ash borer impacts mean that neither of those species is a solution to achieving long-term forested site condition anymore.
On the remainder of the site, there are a very few scattered silver maple, green ash, American elm, boxelder and hackberry that have regenerated post-harvest, as well as at least nine small patches of excellent silver maple regeneration with stems from 1” to 15“ DBH in size in 2020.
We did not solve the mystery of why the small patches of silver maple regenerated successfully post-harvest, while most of the site so far has not. However, we do think there are some valuable takeaways from this study:
2. The correlation between silver maple regeneration success and elevation appears to be complex. In general, higher than average elevations were more likely to support successful silver maple regeneration than lower. However, we found some successful regeneration on relatively low elevations.
We found that most silver maple regeneration patches are on slightly higher than average ground for the site, however several patches were actually on relatively low areas. And while the highest elevations on the site nearest the Vermillion River had adequate ash and elm regeneration, there was little silver maple regeneration there. So it seems clear that silver maple regeneration success must be affected by other factors in addition to site elevation.
3. Reed canarygrass competition was not a major impediment to silver maple regeneration success on this site.
Reed canarygrass is clearly a major impediment to silver maple regeneration on some other bottomland sites, and even in some places on this site. However, that was not the case on most of this site. Heavy reed canarygrass has not become established on much of the area opened up during the various timber harvests. We were surprised that reed canarygrass averaged only about 1% of total cover, with plot frequency of only 4.9%. The levels we observed indicate that as of 2020 it is not a major impediment to tree establishment on most of this site.
4. We did not find any clearly discernable regeneration success differences based on soils, but our sample size was small.
We think that soils impacts on regeneration success would be a good subject for future case studies and more research.
5. Development of consistent regeneration methods for lowland hardwood stands in the Mississippi/Vermillion/Cannon Rivers floodplain is a significant challenge in need of continued attention.
A major question for bottomland hardwoods regeneration in the Mississippi/Vermillion/Cannon Rivers bottoms still in need of further study: Can we figure out why silver maple regeneration has occurred in some places, but not in many other, seemingly similar places? We will continue to examine impacts of harvest and regeneration methods, soils, elevation, relation to reserve trees or patches, and reed canarygrass competition in future studies.
6. Patience and persistence are required.
Based on our findings on this and several other case study sites, we offer that patience and persistence are critical for regenerating this and similar sites in this river bottomland hardwoods system. We need to plan on frequent regeneration checks and adaptive establishment efforts as needed until trees reach “free to grow” stage.
We think that the biggest challenge by far is in getting young seedlings tall enough to withstand some growing season flooding. We need to continue regeneration efforts long enough so that seedlings eventually have a period with 2 or more consecutive years without major summer flooding. That will give seedlings a chance to survive and grow tall enough to withstand periodic summer wet periods. Unfortunately, we can’t know ahead of time when those consecutive normal or dryer summer years might happen.
Seedling size to withstand summer flooding will vary due to site conditions. However, they will certainly need to be over 2 feet tall, and maybe even in some cases 10 feet plus, before we consider them “free to grow”.
2022 Update - summary and closing thoughts
We found minor soil variability, but nothing that we felt could help explain differences in regeneration success on Southern Floodplain Forest native plant community sites
There was some modest variability between our soil samples, but none that we feel would help explain different levels of regeneration success.
Development of consistent regeneration methods for lowland hardwood stands in the Mississippi River floodplain is a significant challenge in need of continued attention.
We were unable to solve the mystery of highly variable regeneration and recruitment success in the Southern Floodplain Forest native plant community through more intensive analysis of soils. There are many factors that may contribute to the variability, including timing and duration of flooding, deposition or removal of seed by floodwaters, harvest and regeneration methods, soils, elevation, influence of water table and reed canary grass competition.
We will continue to examine impacts of harvest and regeneration methods, soils, elevation, influence of water table and reed canary grass competition in future studies.
Supplemental Content
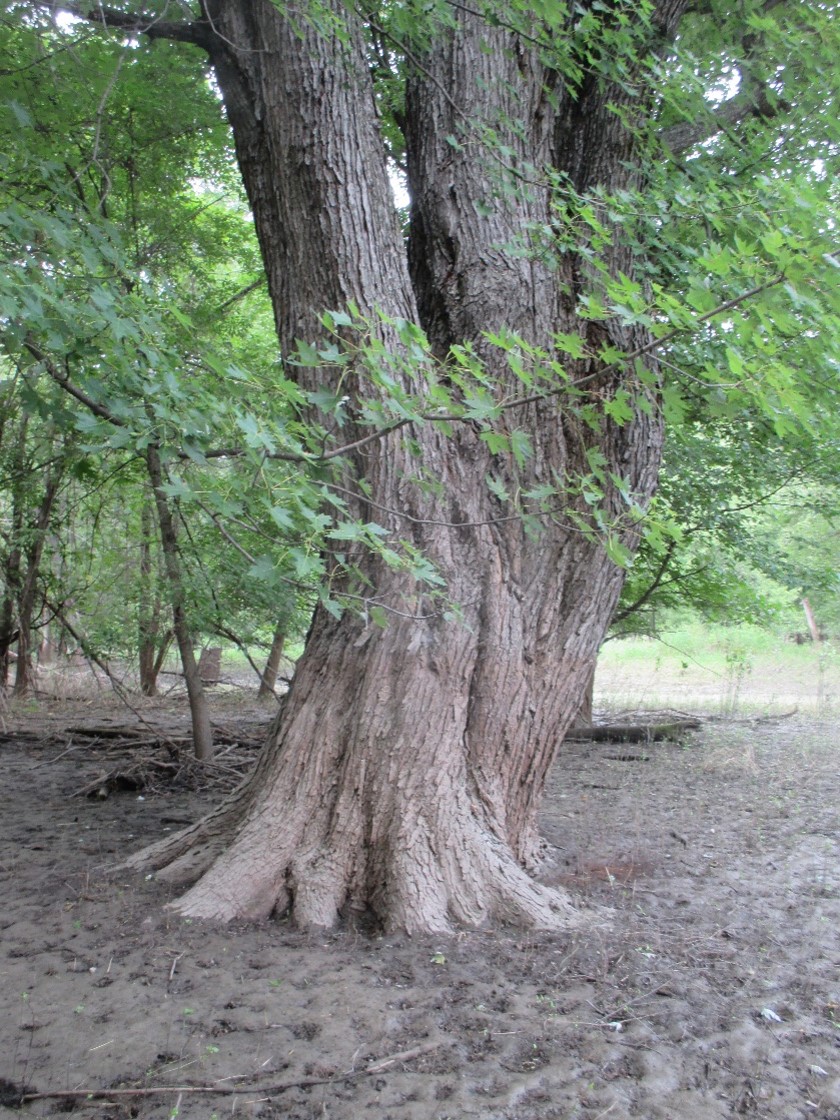
Figure 14: A 25"+ DBH silver maple harvest residual in June 2020
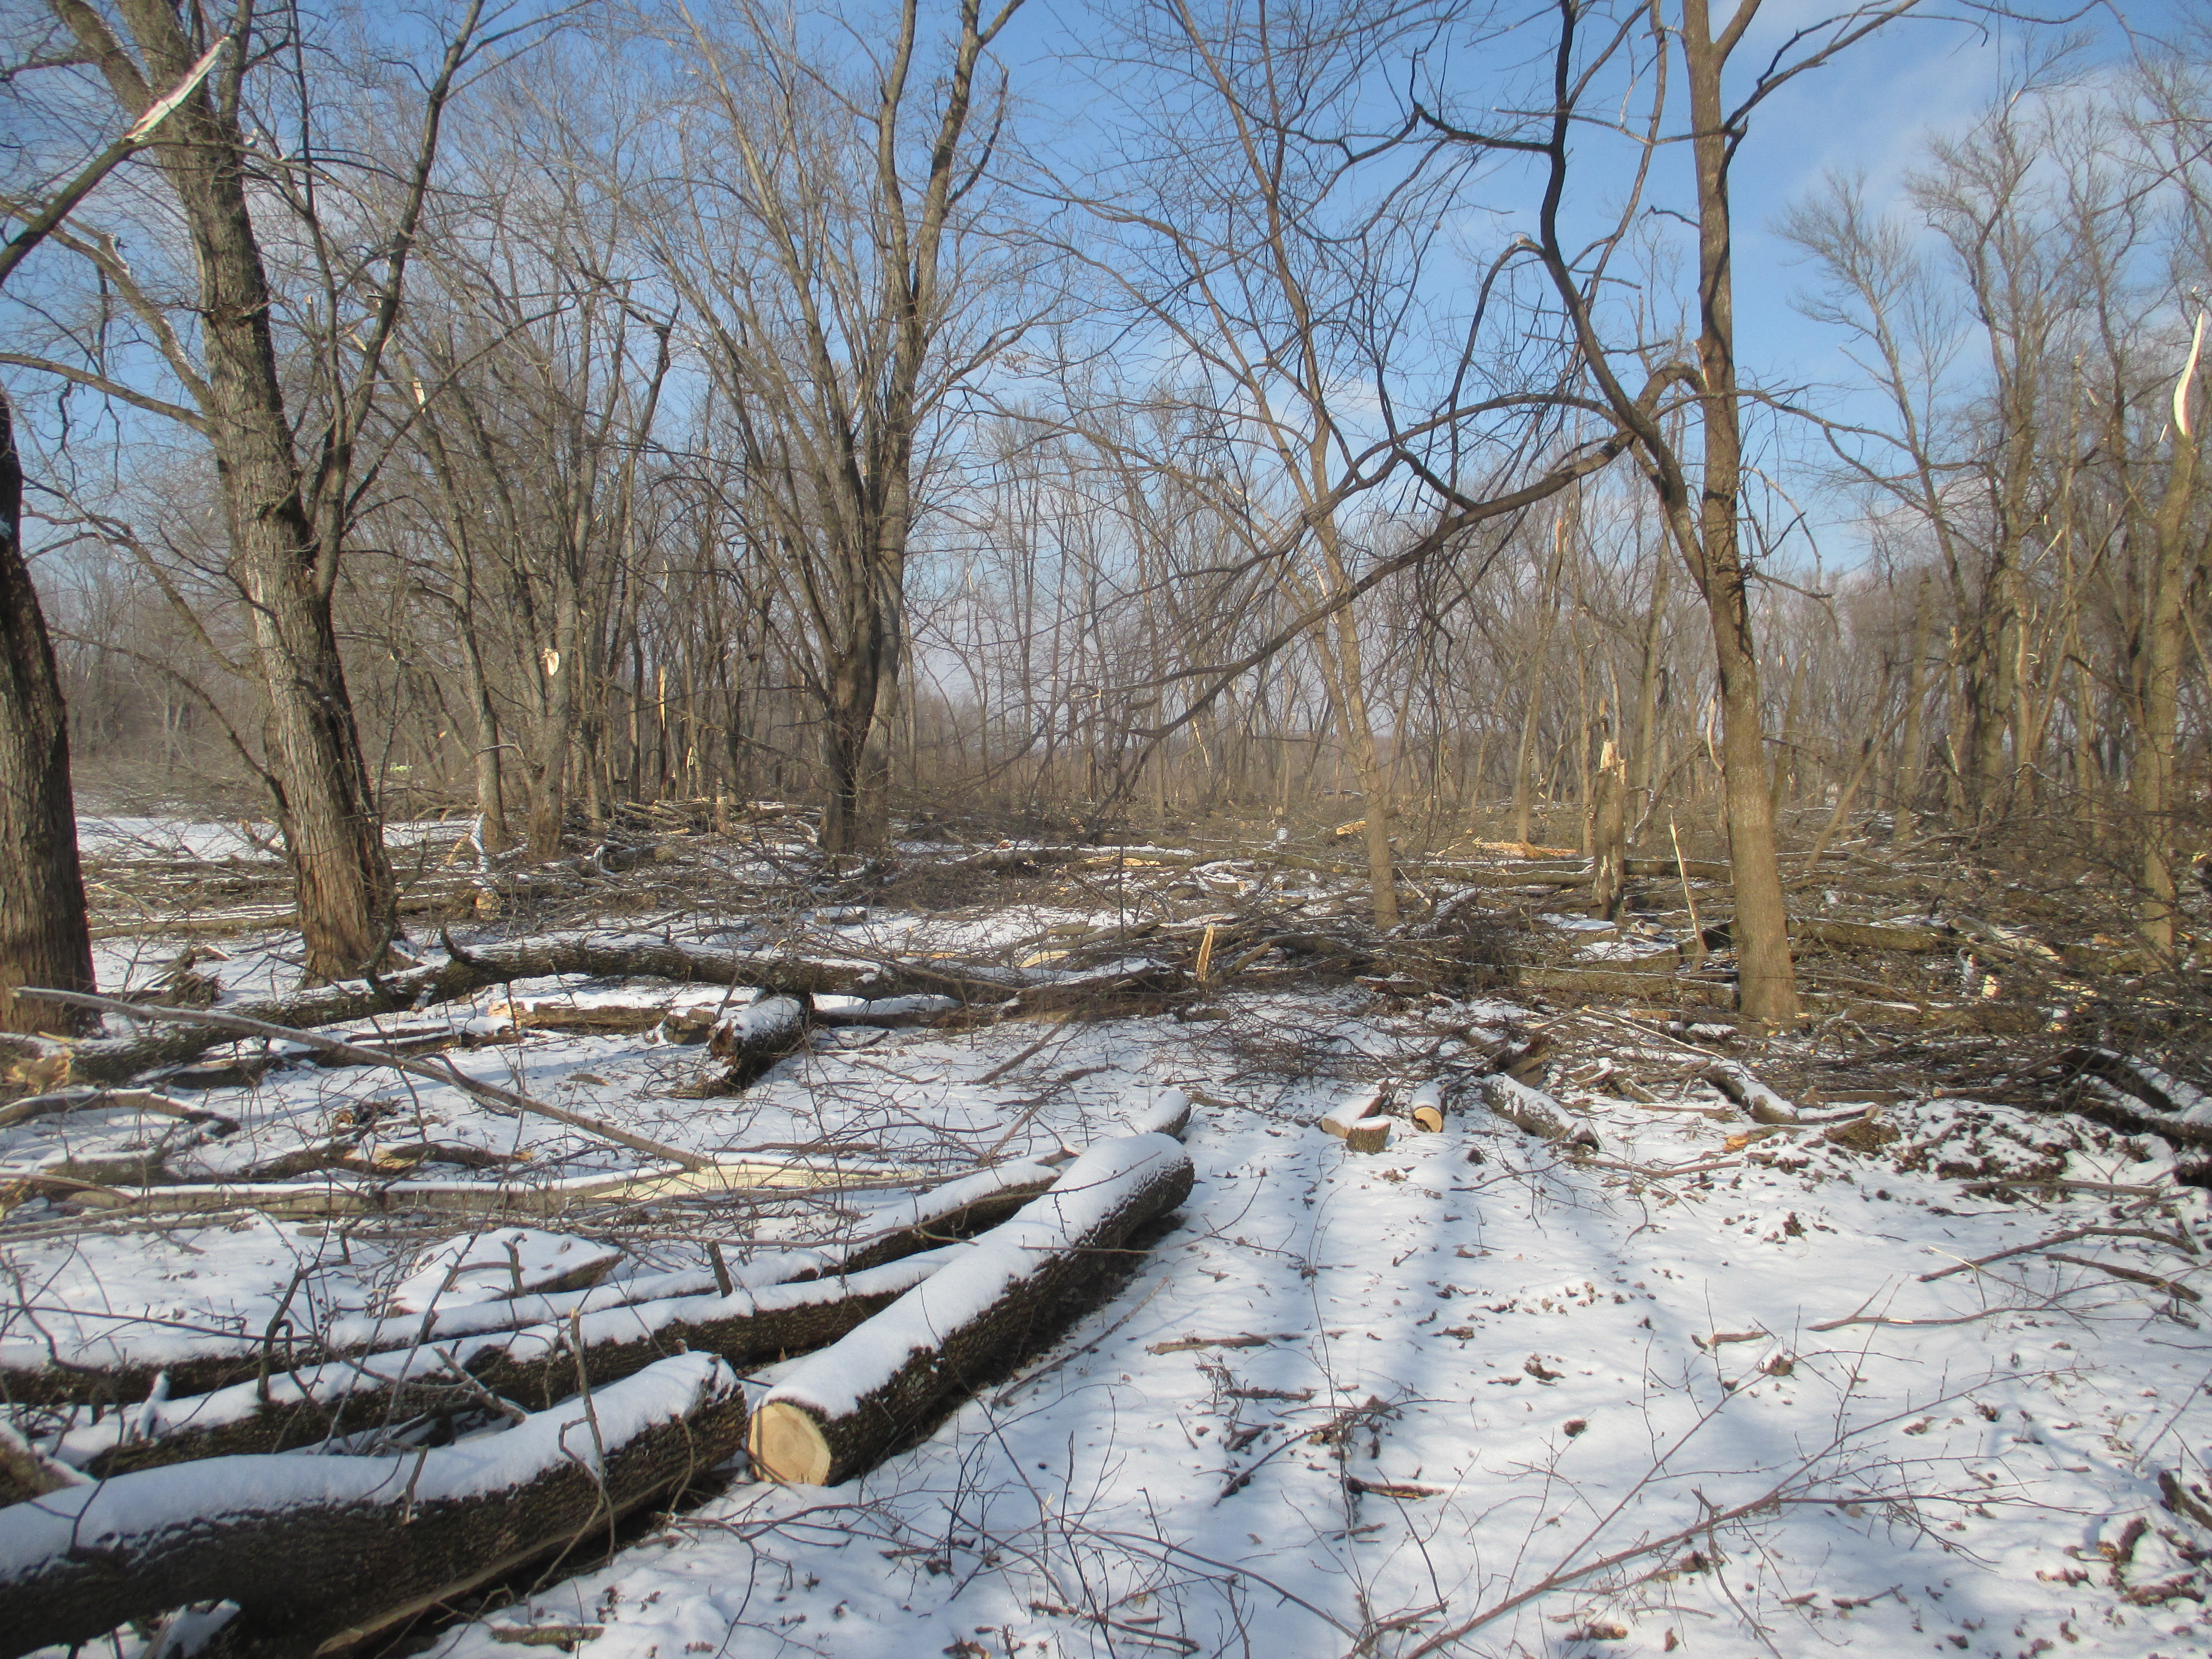
Figure 15: 2019 timber harvest in progress.
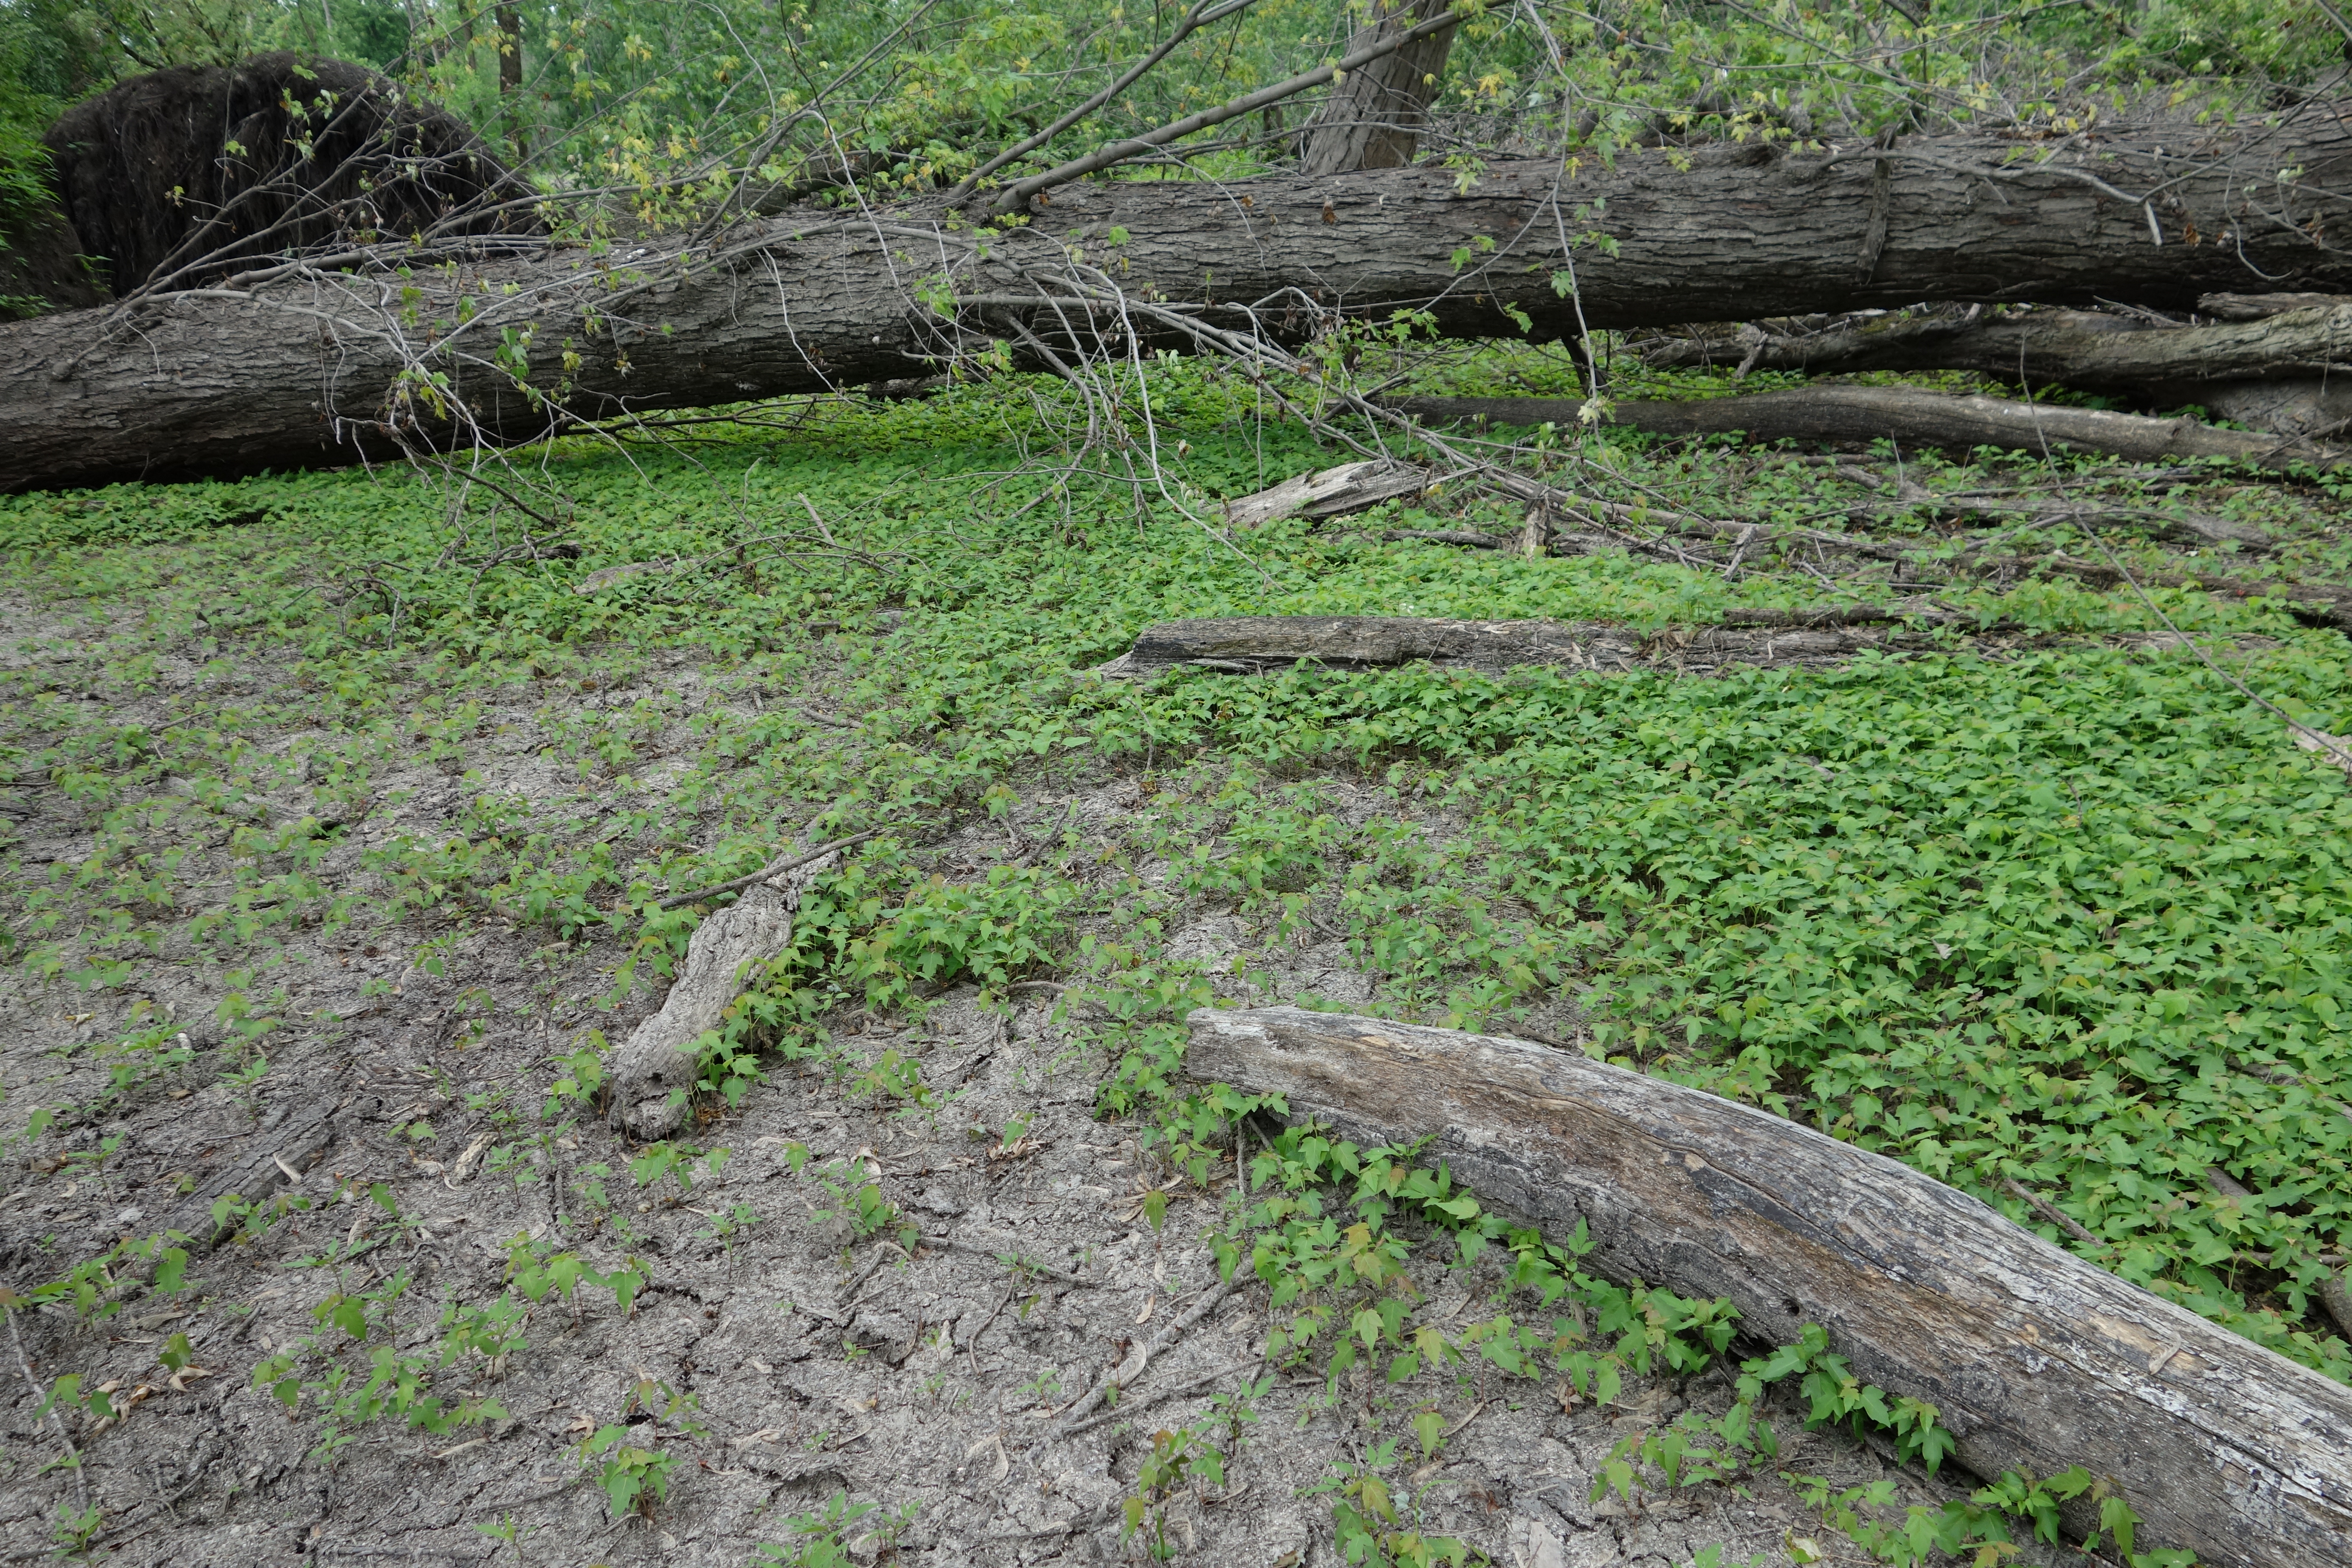
Figure 16: Silver maple regenerants in June 2020
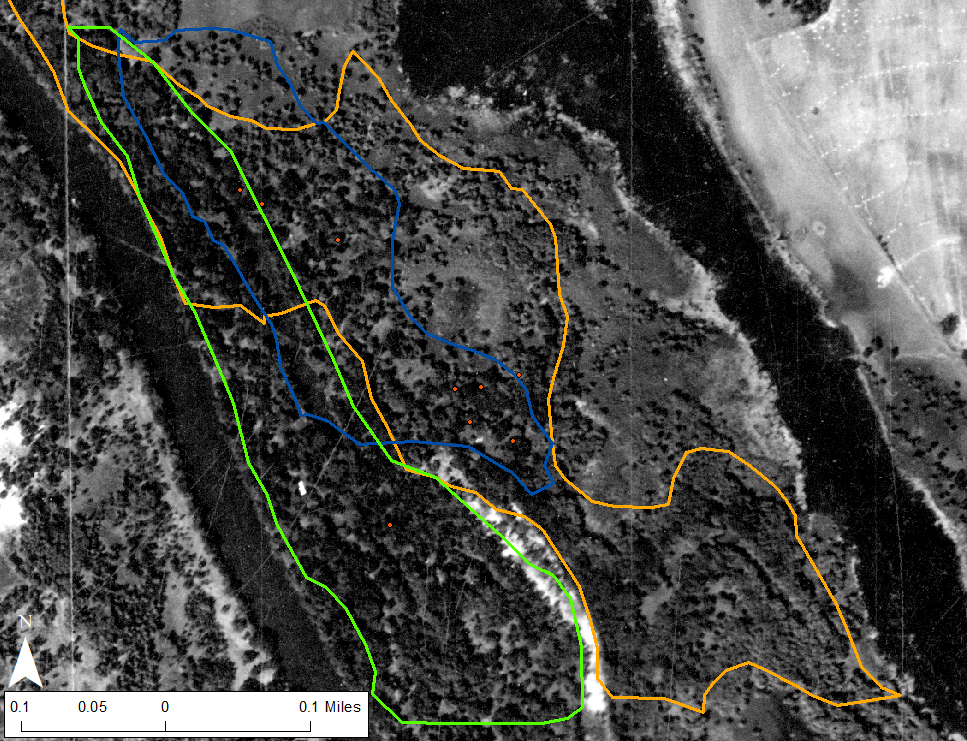
Figure 17: 1938 aerial photo with harvest boundaries and silver maple patches.
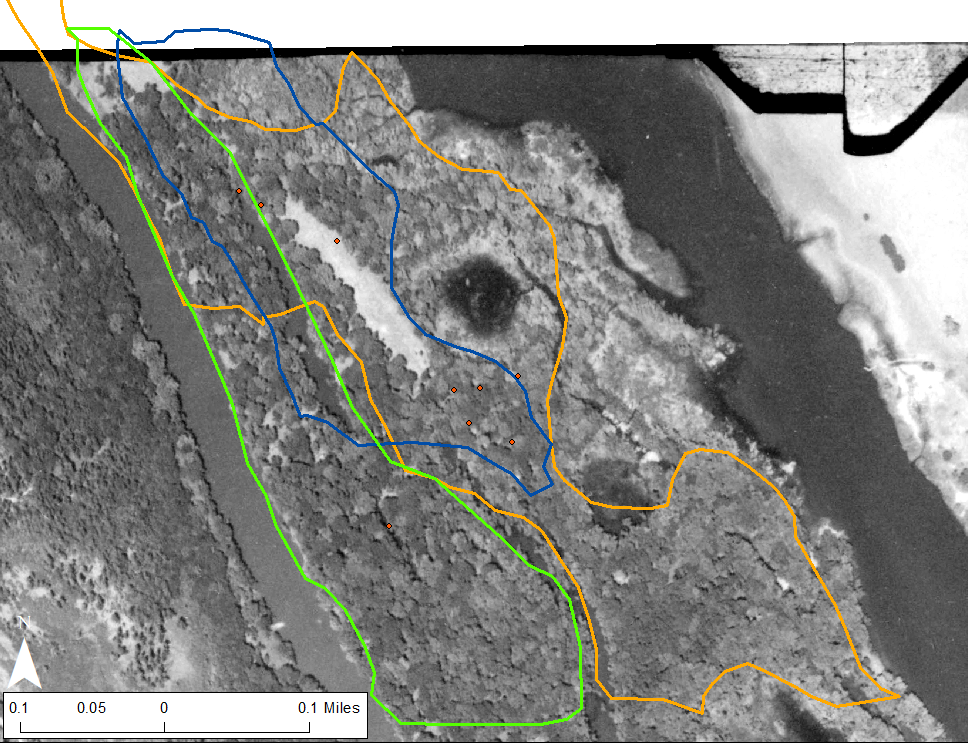
Figure 18: 1957 aerial photo with harvest boundaries and silver maple patches.
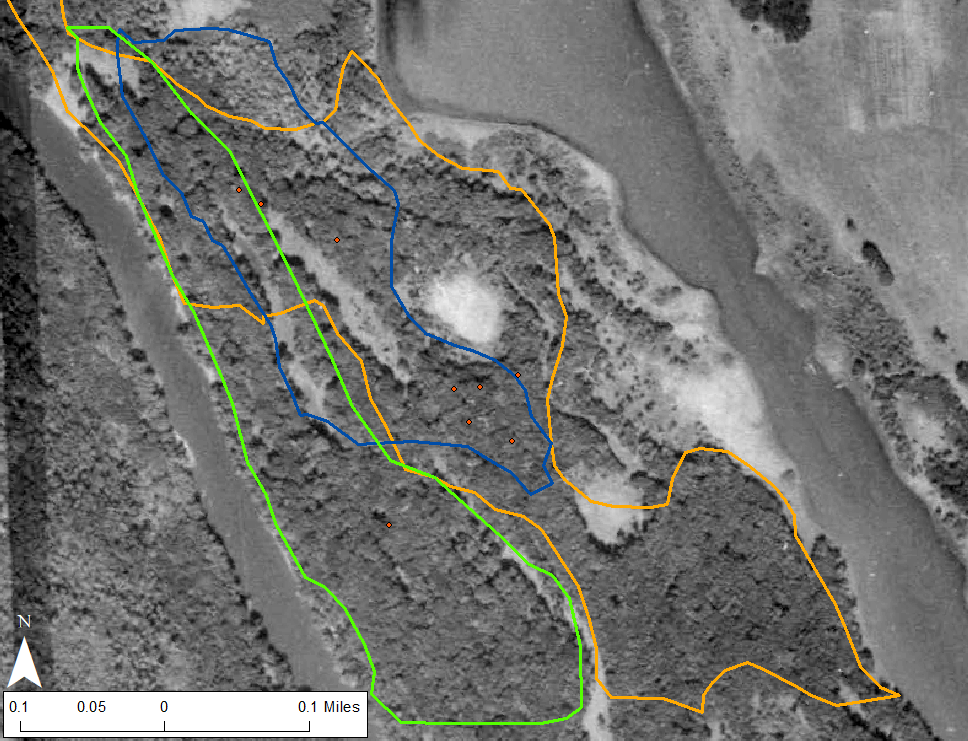
Figure 19: 1970 aerial photo with harvest boundaries and silver maple regeneration patches
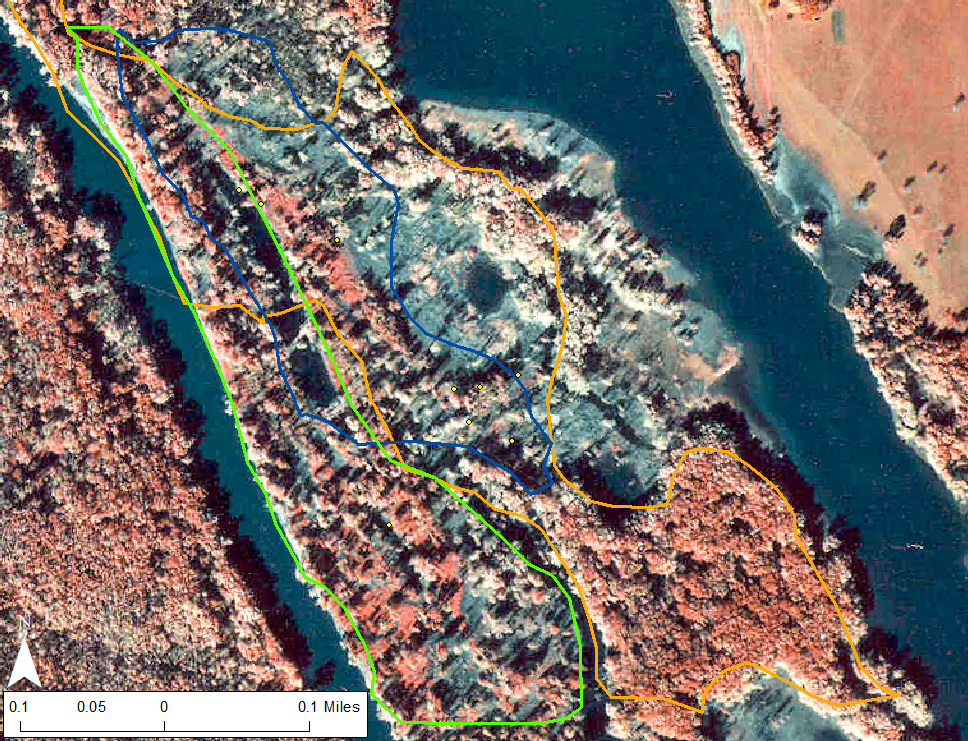
Figure 20: 1993 color IR aerial photo with harvest boundaries and silver maple patch locations.
Figure 21: notes for 3 soil sample points.