
46.696065, -92.537739
Overview
Experimenting with three different crown thinning techniques on red pine and measuring growth over 40 years.
Silviculture Objectives
Three plots were thinned according to Danish standards in 1948 and 1960. The treatments included:
- Plot A: Light thin - thin from below and above
- Plot B: Selection thin - thinning from above
- Plot C: Heavy thin - thinning from above and below
These thinning methods will be discussed further in the prescription section. There were no reported considerations for climate change or other forest health issues; rather, measurements were taken at 4 intervals following the initial treatment in 1948 to monitor the response of red pine to these methods.
Pre-treatment stand description and condition
Stand establishment and management history
This area regenerated following the circa 1910 cutover of the mature pine at the CFC. Records indicate that slash management around the CFC cutovers was burned or cleared with higher care than typical, because it was for the research forest. Four mature red pine seed trees, reserved during the cutover, likely provided the seed for regeneration (see the Life and Times of red pine number 3 of 4 to learn more).
Pre-treatment species composition
Table 1: Plot species composition in trees per acre (TPA) in 1948 prior to the first thin. Plots A and B had very little Scots pine, aspen, and jack pine, while plot C had 88% red pine and 12% jack pine.
Plot | Total TPA | RP TPA |
A | 1322 | 1260 |
B | 1223 | 1166 |
C | 951 | 840 |
Pre-treatment growth and stocking
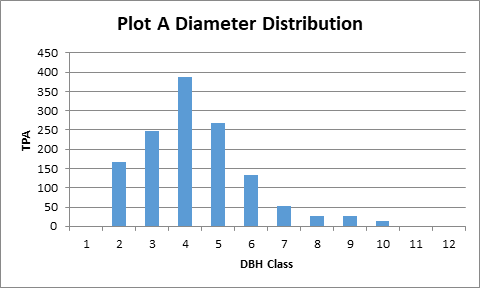
Figure 1: Plot A TPA for each 1-inch diameter class. Plot A is 0.15 acres in size.
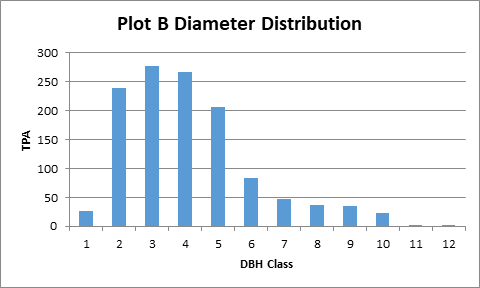
Figure 2: Plot B TPA for each 1-inch diameter class. Plot B is 0.30 acres in size.
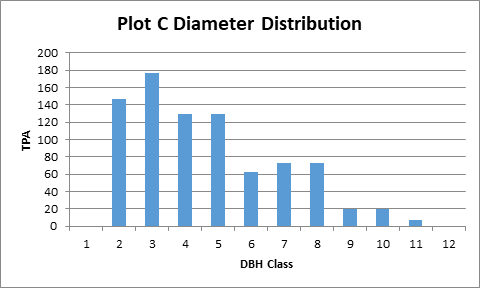
Figure 3: Plot C TPA for each 1-inch diameter class. Plot C is 0.30 acres in size.
Landowner objectives/situation
Part of the mission of the Cloquet Forestry Center per the 2016-2025 Management Plan is to conduct applied research; in particular, to “initiate, attract, and support new and ongoing research related to northern forests, to continue to build credibility through the maintenance of an updated forest inventory, and the application of well-organized and integrated long-term data sets to new problems.” While the treatment took place in 1948, the Cloquet Forestry Center was founded to provide a place for research carried out in northern forests. To that end, applying novel Danish thinning methods to a stand of red pine is well within the scope of the Cloquet Forestry Center.
Silviculture Prescription
The researcher who began this project, Borge Lund-Thomsen, appears to make a distinction between a light thin, described as a thin from below and above, and a heavy thin, described as a thin from above and below (emphasis his). After examining the diameter distributions of the cut trees as a percentage of total trees per acre, it can be assumed with reasonable confidence that this treatment included elements of both a thin from below and a thin from above with different emphasis on certain diameters or crown classes depending on whether the treatment was applied to plot A or plot C. Two entries were planned, with one treatment taking place in 1948 and a second, similar treatment to take place in 1960. The entirety of these plots was treated for a total size of 0.75 acres. Following the second treatment, the stands were to be monitored. The goal of this research project was to see how the Danish thinning methods affected red pine and consequently most non-red pine trees were targeted for removal—though even before the treatment the stands were heavily dominated by red pine from a species composition perspective.
What actually happened during the treatment
A fourth plot, southeast of plot A (see supplemental Figure 1), was supposed to receive a heavy thin but was never cut. Trees were only tallied and marked for a cut that would never occur: plot D was not cut later and was not mentioned in subsequent research documents. With regards to plots A-C, according to the project abstract “Felling was done with an axe and all stumps were cut at ground level. Bucking was done after all felling and swamping had been completed. The tops were trimmed to the very tip and the slash was left where it fell.” The light thin removed the smallest amount of basal area, totaling 24 ft2ac-1 while the selection and heavy thins removed approximately 40 ft2ac-1 (Table 2).
Table 2: pre-treatment and residual basal area per acre. Plot A received a light thin, plot B received a selection thin, and plot C received a heavy thin.
Plot | Pre-Treatment BA (ft2) | Residual BA (ft2) |
A | 155 | 131 |
B | 146 | 102 |
C | 147 | 106 |
The QMD of plot A (light thin) before the treatment was 4.6” and after the treatment it was calculated to be 4.8”; for plot B (selection thin) the QMD was 4.7” before and 4.3” after; and for plot C (heavy thin) the QMD was 5.3” both before and after the treatment. The QMD of the cut trees in plot A was 4.1”, and the diameter distribution shows that trees of the lower crown classes were heavily favored but some dominant and co-dominant trees were removed as well (Figure 4). Plot B was thinned from the top, with a QMD of the cut trees of 6.5” (Figure 5). The QMD of the cut trees in plot C was 5.3”, consistent with no change in the pre- and post-treatment QMD (Figure 6).

Figure 4: The cut and residual TPA for each 1-inch diameter class in plot A - which received a light thin treatment - shown together as the pre-treatment TPA. QMD of cut trees was 4.1 inches.
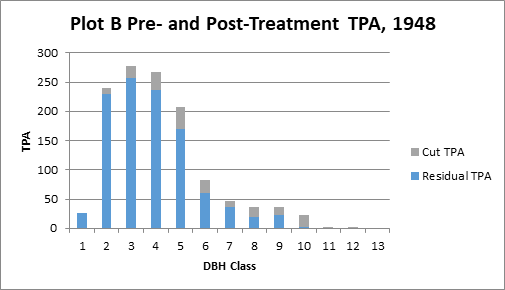
Figure 5: The cut and residual TPA for each 1-inch diameter class in plot B - which received a selection thin treatment - shown together as the pre-treatment TPA. QMD of cut trees was 6.5 inches.
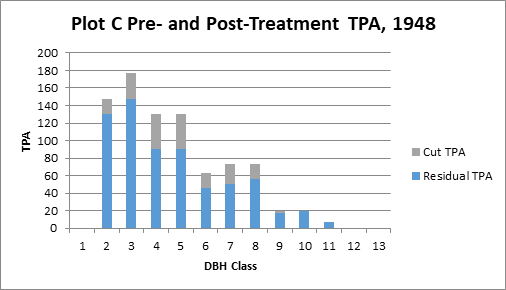
Figure 6: The cut and residual TPA for each 1-inch diameter class in plot C - which received a heavy thin treatment - shown together as the pre-treatment TPA. QMD of cut trees was 5.3 inches.
Post-treatment assessment
Following the treatment in 1948, the stand was measured again in 1960. A total tree census was taken at that time, continuing measurements taken in 1948: DBH and crown class were recorded for every tree and tree heights were intermittently taken. Following those measurements, the treatment was renewed in the same year. Plot A again saw the lowest amount of basal area removed in this entry, with 34 ft2ac-1, but plots B and C had 46 and 39 ft2ac-1 removed, respectively (Table 4).
Table 3: Pre-treatment and residual basal area per acre for the 1960 entry.
Plot | Pre-Treatment BA (ft2) | Residual BA (ft2) |
A | 199 | 166 |
B | 178 | 132 |
C | 154 | 115 |
The diameters and crown classes targeted in the 1960 entry were generally consistent with those in 1948 with relation to the QMD. The QMD of plot A, treated with a light thin, was 6.1” before and 6.2” after with the QMD of the cut trees calculated as 5.5” (Figure 7). Plot B, treated with a selection thin, had a QMD of 5.6” before and 5.1” after with the QMD of cut trees of 8.2” (Figure 8). Lastly, the QMD of plot C, treated with a heavy thin, was 6.5” before, 6.3” after, and the QMD of the cut trees was 7.3” (Figure 9).
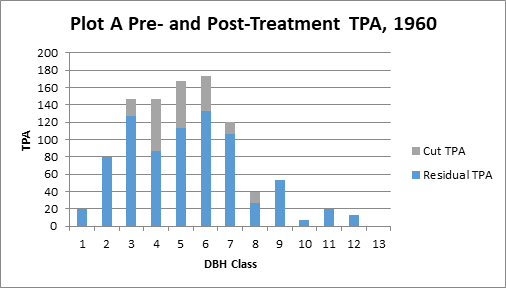
Figure 7: The cut and residual TPA for each 1-inch diameter class in plot A, shown together as the pre-treatment TPA, for the 1960 treatment. QMD of cut trees was 5.5 inches.

Figure 8: The cut and residual TPA for each 1-inch diameter class in plot B, shown together as the pre-treatment TPA, for the 1960 treatment. QMD of cut trees was 8.2 inches.
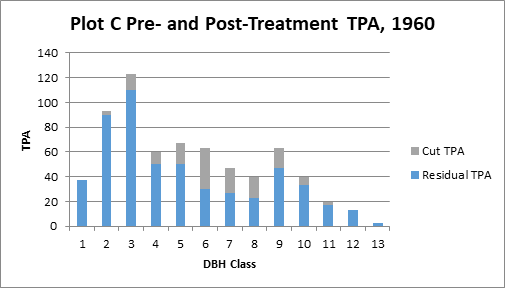
Figure 9: The cut and residual TPA for each 1-inch diameter class in plot C, shown together as the pre-treatment TPA, for the 1960 treatment. QMD of cut trees was 7.3 inches.
While there are no more treatments, the total tree census was continued in 1966, 1971, and 1985. In 1985 the total heights of all remaining trees were taken (Table 4). Plot A, with a stronger emphasis on trees of lower crown class, has the highest average height. Plots B and C, which were thinned with varying emphasis on trees of dominant and codominant crown classes, have lower average heights that are almost identical.
Table 4: The arithmetic average height of the remaining trees in the treatment area in 1985, in feet.
Plot | Avg. Ht. (ft) |
A | 71.1 |
B | 63.7 |
C | 63.9 |
In addition, the diameters at breast height of every tree continued to be recorded which allowed basal area per acre to be calculated over time from the beginning of the first treatment in 1948 through 1985 (Figure 10). The light thin had the highest basal area per acre over time, though that could be accounted for at least partially through a smaller amount of basal area removed at both entries. On an individual tree perspective, however, the QMD of the light thin was only 1.1” less than that of the heavy thin treatment despite having almost 80 more square feet per acre of basal area (Figure 11). The selection thin led to a QMD of 8.2” and 30 more square feet per acre of basal area than the heavy thin.
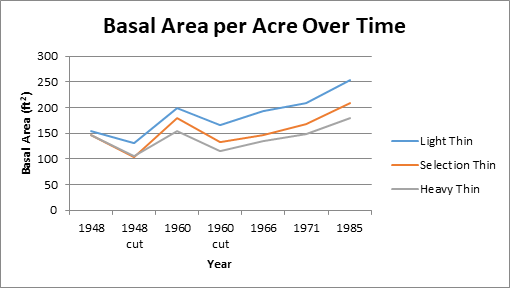
Figure 10: Basal area per acre over 37 years. Plot A was thinned from below and above, plot B was thinned from the top, and plot C was thinned from above and below.
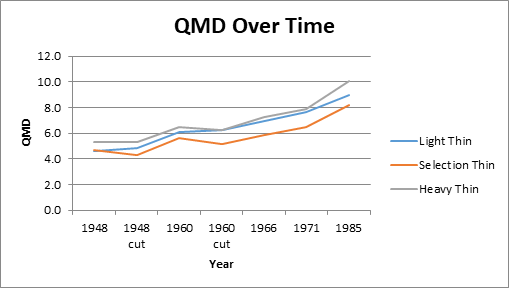
Figure 11: QMD for each of the stands over time.
Plans for future treatments
These plots were part of an area that was thinned to an average of 120 ft2ac-1 in 1986 which effectively ended the research on this site.
Summary / lessons learned / additional thoughts
The results of this case study should be taken with a grain of salt because they only have one plot per thinning technique. Even so, they suggest that each thinning technique has viability as an option for first or second thinnings in 35-40 year old red pine and that there are individual tree and stand-level tradeoffs to each technique.
Individual tree growth, as suggested by average QMD, was strongest in the Heavy thin (Plot C) treatment. However, stand-level BA was highest in the Light thin plot (Plot A). The Selection thin (Plot B) had moderate BA, the lowest QMD, and height growth equivalent to the Heavy thin. Interestingly, the average height in the Light thin (Plot A) was seven feet taller than the other two plots in 1985. In theory, stand density should not influence height growth and the site's Site Index.
These results suggest that today's foresters have options for thinning red pine stands. If they want to focus on maintaining a high stand BA and individual tree height growth, they should conduct lighter thinnings. If they want to focus the growth on fewer bigger trees, they can conduct a heavier thinning. There may be limb-retention tradeoffs associated with these options, though this study did not track this.
Supplemental Content

Supplemental figure 1: the coversheet for the Danish thin research records, drawn on trace paper and later digitized. Recall that no action was taken in plot D.
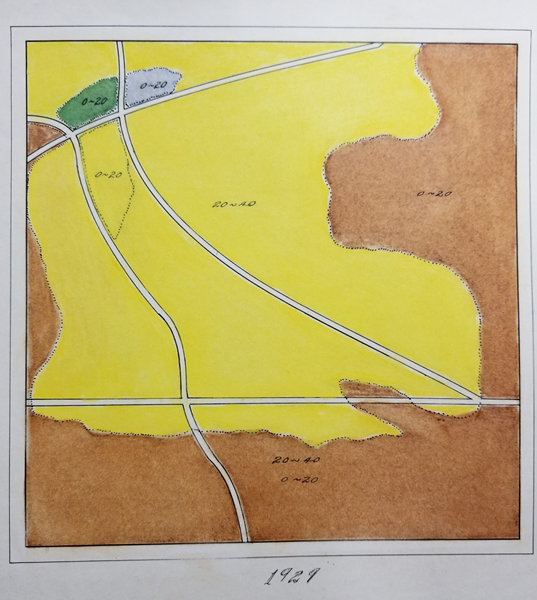
Supplemental figure 2: Hand-drawn vegetation cover-type map from 1929. The Danish thin plots are in the 0-20 age class area in the upper left, between the two roads running roughly northwest to southeast. The yellow areas are jack pine, while the green areas are red pine.
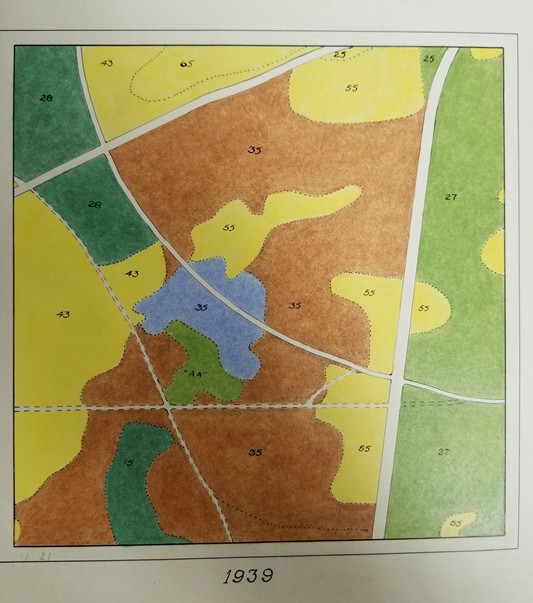
Supplemental figure 3: Hand-drawn covertype map from 1939. The Danish thin plots are in the 28 year old area in the upper left.