46.101808, -92.481827
Overview
The exclosure study site is dominated by a mix of northern hardwoods and oak and classified as Central Dry-Mesic Oak-Aspen-Red Maple Forest type (MHc26a). The pre-settlement disturbance regime for this MHc26 native plant community (NPC) was primarily from light surface fire that created partial mortality of the canopy with an estimated rotation of about 75 years. As this is a mesic hardwood community the fires were not catastrophic in scale but with a relatively warmer climate in the central part of the state, ground layer fuels were often dry enough to carry surface fires that provided seedbed and open conditions for regeneration of mid-tolerant species such as red oak. The use of even-age shelterwood management can be used to create large gap openings over time but can prove tricky in maintaining a balance between creating conditions favorable for the species of interest in the face of competition from other species. Site preparation and follow up release techniques can be used to deal with this challenge, but there is a risk that these techniques may have unintended consequences by changing the plant composition of these forests. The pressure from deer herbivory further complicates management.
Questions of interest were:
- Does deer browse alter plant composition and/or set the plant community on a different trajectory than would normally be seen for that community?
- If there is change in plant community composition, are the changes temporary, and what groups of species are favored?
- Are deer browse impacts creating a shift in competitiveness for certain species of interest?
- Does use of deer exclosures reduce competitive exclusion of certain species, altering which species dominate?
To better understand the interplay between these tradeoffs and ecological processes, we tried a variety of methods to reduce deer browse and finally established a fenced deer exclosure within a 1994 shelterwood harvest unit. The initial shelterwood harvest was conducted on 14 acres within the larger stand and was conducted in winter 1994-95. The site was rock raked in December 1995. Broadcast spray of glyphosate and triclopyr was done in August 1996. Red oak and white ash seedlings were planted in May 1997. The second step shelterwood harvest was done in winter 2000-2001. In May 2004, woody plants around crop trees were mechanically cut with brush saws. In fall 2004, multiple stem oak seedlings were hand pruned, leaving one main leader.
Plantskydd was applied in fall 1998. Oaks were bud capped with balloons fall of 2002 and 2003. Exclosures were built in September 2004: 5.2 acre (2.1 ha) plastic mesh exclosure (east site) and 8.4 acre (3.4 ha) wire mesh exclosure (west site). The exclosures were taken down in October 2013. Repeated sampling of woody regeneration transects and vegetation composition (relevé) data were collected in fall 2004, 2005, 2010 and 2018. Specifically, regeneration and browse on woody plants were assessed along transects; two inside the west exclosure and two outside of the exclosures. Each transect was 75 meters long. Vegetation was characterized by assigning frequency and plant cover for all height strata inside and outside the exclosure over three sample times 2004, 2010, and 2018 by using the relevé method (Mueller-Dombois and Ellenberg, 1974; Minnesota Department of Natural Resources, 2007). An additional relevé plot was entered as a reference (Control) and was conducted in 1994 approximately 200 meters to the NW and classified as a mature MHc26. We found dramatic differences in tree regeneration and plant community successional trajectories between areas within and outside of the deer exclosure.
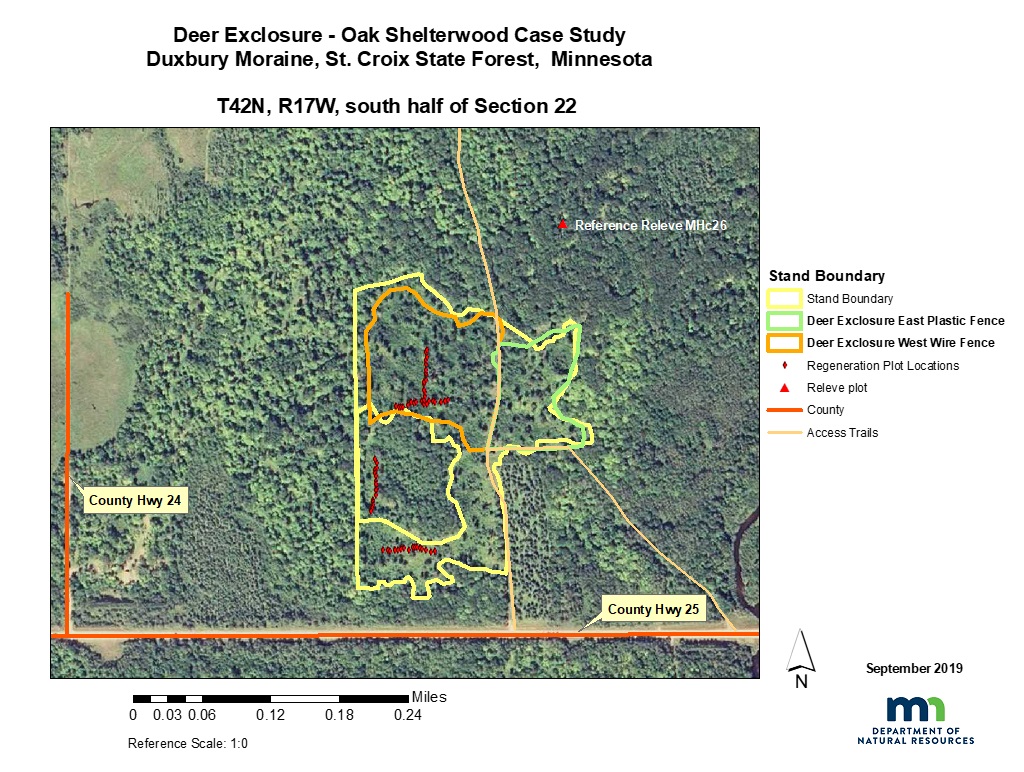
Figure 1: Study site and plot location
Silviculture Objective(s)
The objective was to promote regeneration of a Central Dry-Mesic Oak-Aspen-Red Maple Forest type (MHc26a) focusing on adequate amounts of red oak with some aspen and birch. Deer herbivory has hindered regeneration success and therefore various protection measures were implemented. Initially Plantskydd, Repel, and bud capping were tried, but with limited success, so deer exclosure fencing was implemented.
Pre-treatment stand description and condition
Stand establishment and management history:
The site has been classified as Central Dry-Mesic Oak-Aspen-Red Maple Forest type (MHc26a) by Minnesota Biological Survey (MBS) ecologists and mapped as a mix of northern hardwoods and oak cover type in the Forestry FIM inventory. The pre-settlement disturbance regime for this MHc26 native plant community (NPC) was primarily light surface fire that created partial mortality of the canopy with an estimated rotation of about 75 years.
Pre-treatment species composition:
|
Species marked (1994) |
Removed (ft.2) |
Volume/acre (cd./acre) |
Residual Basal area (ft.2) |
|
Sugar Maple |
27 |
5.0 |
23 |
|
Basswood |
1 |
0.2 |
11 |
|
Red Oak |
1 |
0.5 |
10 |
|
Red Maple |
2 |
0.7 |
3 |
|
Ash species |
|
|
1 |
|
Bur Oak |
|
|
0.5 |
|
Aspen species |
|
|
0.5 |
|
Birch species |
0.5 |
0.2 |
0.5 |
|
Total |
31.5 |
6.6 |
49.5 |
Landowner objectives/situation:
While specific objectives vary from parcel to parcel, lands under the administration of DNR-Forestry are managed in alignment with Section Forest Resource Management Plans (SFRMP) to ensure that state forest management activities meet statewide goals for ecological protection, timber production, and cultural/recreational values. The DNR assembles teams from the Divisions of Forestry, Fish & Wildlife, and Ecological & Water Resources who work with partners and the public to develop SFRMPs.
Silviculture Prescription
The prescription for this site was to use a two-step shelterwood with site preparation, planting and deer browse protection to move a mature Dry-Mesic Oak-Aspen Forest to a young Central Dry-Mesic Oak-Aspen-Red Maple Forest type (MHc26a) while maintaining an oak component. Specifically, the prescription called for removing sufficient basal area in the first entry to leave ~60% basal area in order to provide adequate light conditions to favor establishment and growth of northern red oak but limit establishment and recruitment of competing species. Reserved trees were selected for improved quality for veneer as well as acorn production. The prescription called for removal of the overwood once the regeneration was well established. Oak regeneration targets 10-15 after treatment were 400 well-spaced trees per acre. Current standards for mesic central hardwoods 15 years after harvest are 100 to 300 crop trees per acre that are free-to-grow on 75% of plots.
What actually happened during the treatment
Two step shelterwood with under planting:
Initial harvest during winter of 1994 – Residual basal area target of 49.5 ft2
- Shelterwood trees to be reserved were selected based on a combination of basal area and crown cover. All trees 5” dbh and under except oak were designated for removal.
- Site preparation following harvest was conducted by rock raking and one year following (August), an herbicide application of Glyphosate mixed with (3qts with120 qts. water). Weather conditions were partly cloudy, 73 degrees F and RH 57%.
- Just prior to spring planting, a fuelwood sale was used to lower crown cover further followed with stump application of Garlon 4 (Triclopyr).
- Hand planting spring 1997 – A total of 14,000 2-0 Red Oak (800 trees per acre), and 2,000 2-0 White Ash were planted. Some mortality occurred due to low rainfall at the end of June.
- Deer protection – In October of 1998 deer repellantPlantskydd was applied by Area Staff & MCC.
Second shelterwood entry during winter 2000-2001 – Residual basal area between 10-20 ft2
- Bud capping took place in 2002 with 660 trees/acre capped with balloons and joint tape.
- More bud capping took place in 2003 on around 670 trees/acre; and again in 2004 on 670 trees/acre for trees on 13 acres outside of fence
- Two fenced deer exclosures were installed in September 2004. A 5.2 acre exclosure using plastic mesh fencing on the east side and an 8.2 acre exclosure using wire mesh fencing on the west side.
- Following regeneration checks in spring 2004, a mechanical brush-saw stand improvement treatment was conducted to remove competition and release red oak, ash, and paper birch crop trees. Hand pruning of multi-stemmed oak was done fall of 2004.
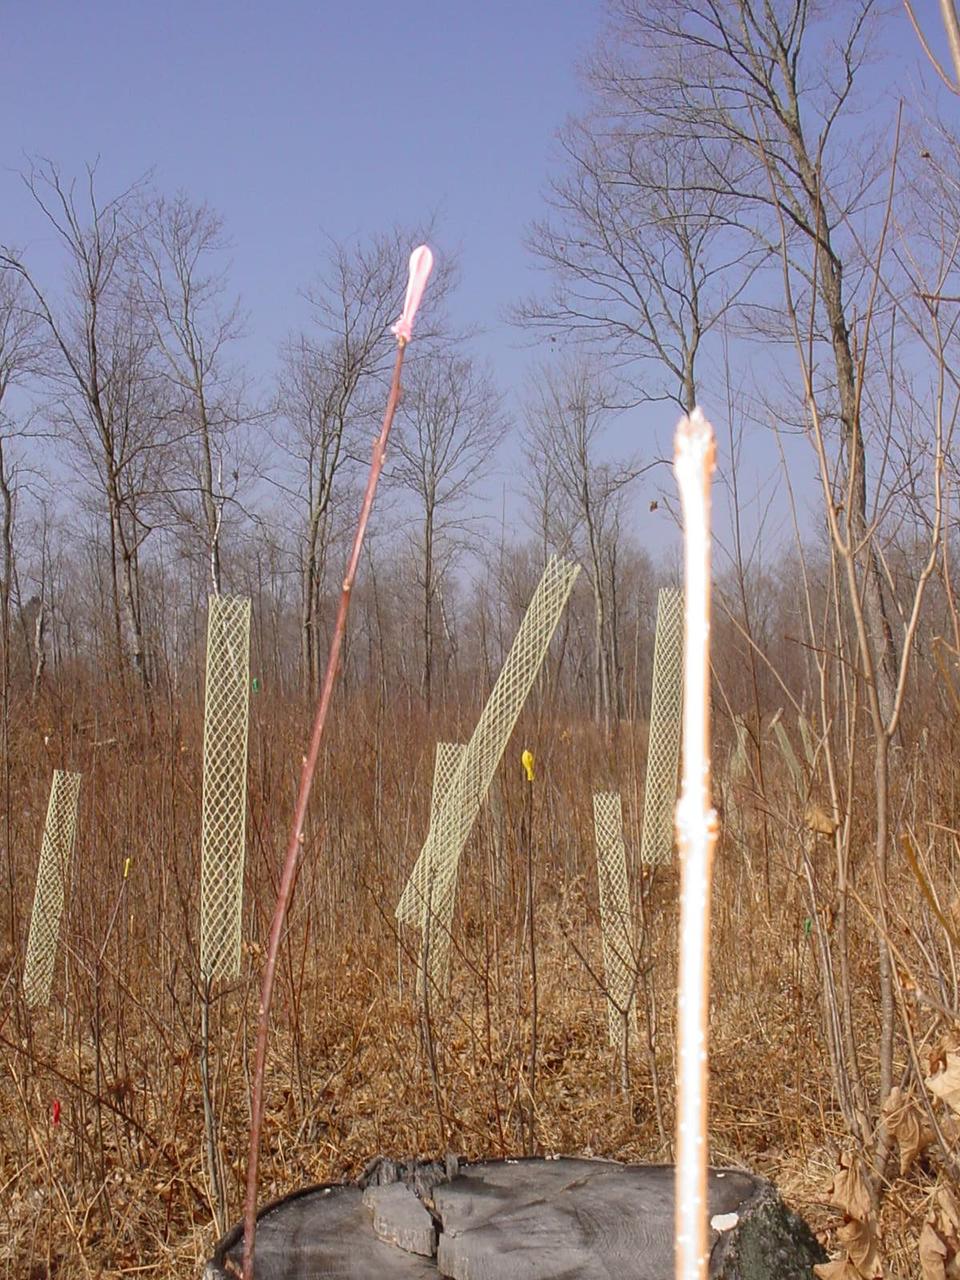
Figure 2: Balloon capping and mesh tubes, March 25, 2003, photo by Doug Hecker
Post-treatment assessment
Regeneration checks with results in in trees per acre.
|
Trees per acre |
1998 |
1999 |
2000 |
2004 |
|
Red oak |
691 |
882 |
1125 |
686 |
|
White Ash |
100 |
88 |
125 |
15 |
|
Black Ash |
119 |
-- |
||
|
Red Maple |
595 |
1618 |
-- |
872 |
|
Sugar Maple |
286 |
|
-- |
|
|
|
|
|
|
|
|
Paper Birch |
-- |
412 |
650 |
29 |
|
Basswood |
-- |
-- |
50 |
-- |
Crop tree competition assessment 2004:
Competitors: Aspen, Maple and Birch species with an average height of 2-4 ft., 50% stocking
Crop Trees: Red Oak (1,110 stems/acre), ash (125 stems/acre) and basswood (50 stems/acre) with an average height of 2-3 ft. and 95% stocking.
According to DNR records in the FIM database, the stand basal area in 2007 was 18 ft2/acre.
Basal area check inside and outside Exclosures in 2019: (Basal area collected on regeneration plots. Total basal area includes residual and regenerating trees)
|
Location |
Mean Residual BA (ft2/acre) |
Mean Total BA (ft2/acre) |
|
Inside |
17.2 |
93.4 |
|
Outside |
25.0 |
70.3 |
Results
Regeneration Transects Inside and Outside Exclosure
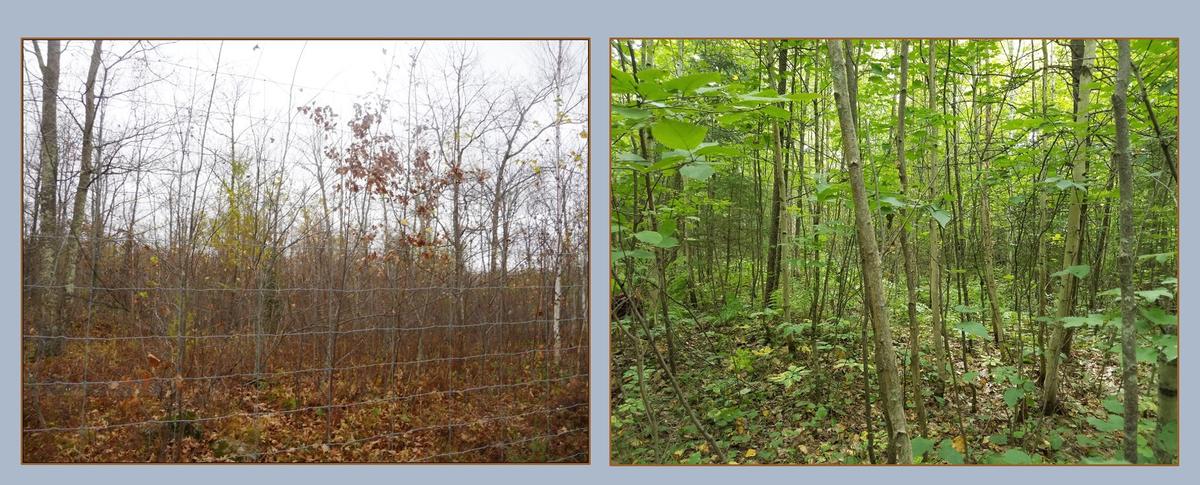
Regenerating woody species abundance varied both over time and by whether there was deer fencing protection, with initial results indicating higher abundance of oak regeneration inside the deer exclosure. Red oak density (mean trees per acre – TPA), was tested using the non-parametric Kruskal Wallis chi-squared test. Differences between TPA inside and outside the exclosures were significantly different for 2010 (X=2.66, p=0.014) and nearly significant for 2018 (X=3.04, p=0.08). Maple species abundance increased inside the exclosures and decreased outside the exclosures. Aspen abundance remained steady over time inside the exclosures while increasing slightly outside the exclosures. Birch density fluctuated with a surge in growth inside the exclosures in 2010 but dropped back down below levels outside the exclosures by 2018. Dominant shrubs inside the exclosure were honeysuckle and willow, which stayed relatively short. Dominant shrub species outside the exclosure were hazel and willow.
Inside the Deer Exclosures
Inside the exclosures, understory and midstory tree regeneration in 2004 was composed of a mixture of species such as aspen, maple (both sugar and red) and birch (see Supplemental Table 4). Relative abundances of tree species varied over time, with a general decline in dominance of early seral species such as aspen. By 2005, the relative dominance of red oak was slightly more than aspen in the lower height classes (<6ft.). In 2010, maple and birch species continued to increase in height classes 4 and 5 (4-5ft.). There was continual recruitment of red and sugar maple in the lowest height classes. Red oak seedlings already in the tallest height class persisted throughout the time of the study. Recruitment of red oak seedlings into the lowest height class was constant for the entire study although they did not move into the two middle height classes.
The exclosure fencing was removed in 2013. While the red oak density declined after the fencing was removed, red maple density increased and sugar maple density remained at similar levels. Shrub dominance before 2010 was by hazel and raspberry. In 2010 bush honeysuckle became a more prominent shrub species. It is difficult to follow the changes in raspberry abundance over time as it was tallied primarily in 2004 while for the latter years only a cover class was assigned.
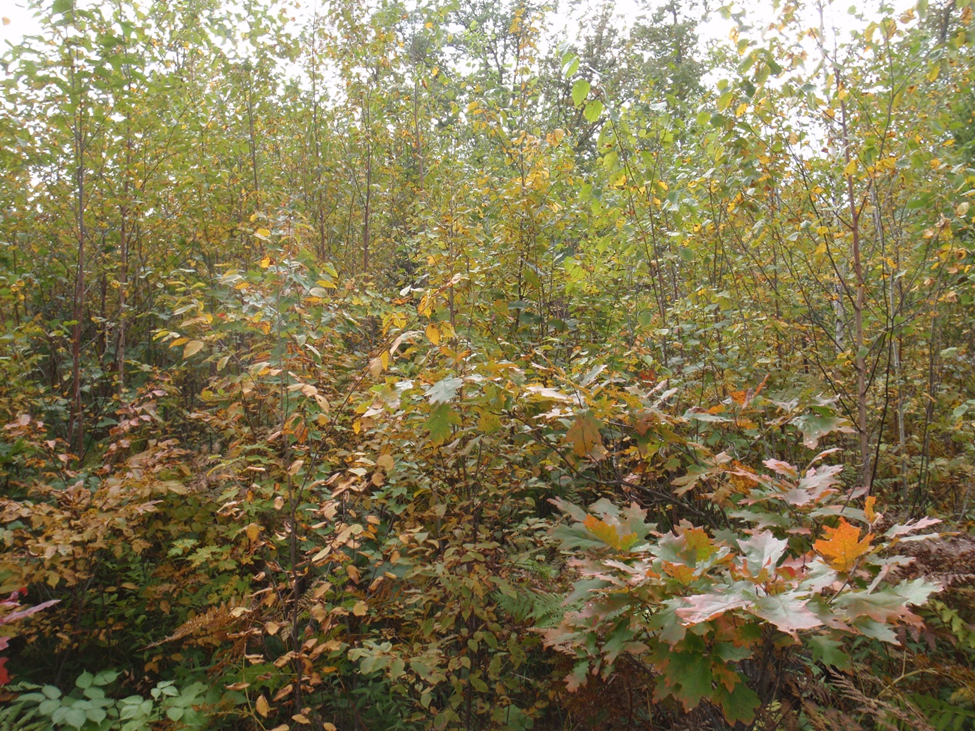
Figure 3: Inside Exclosure 2010, photo by Brooke Haworth
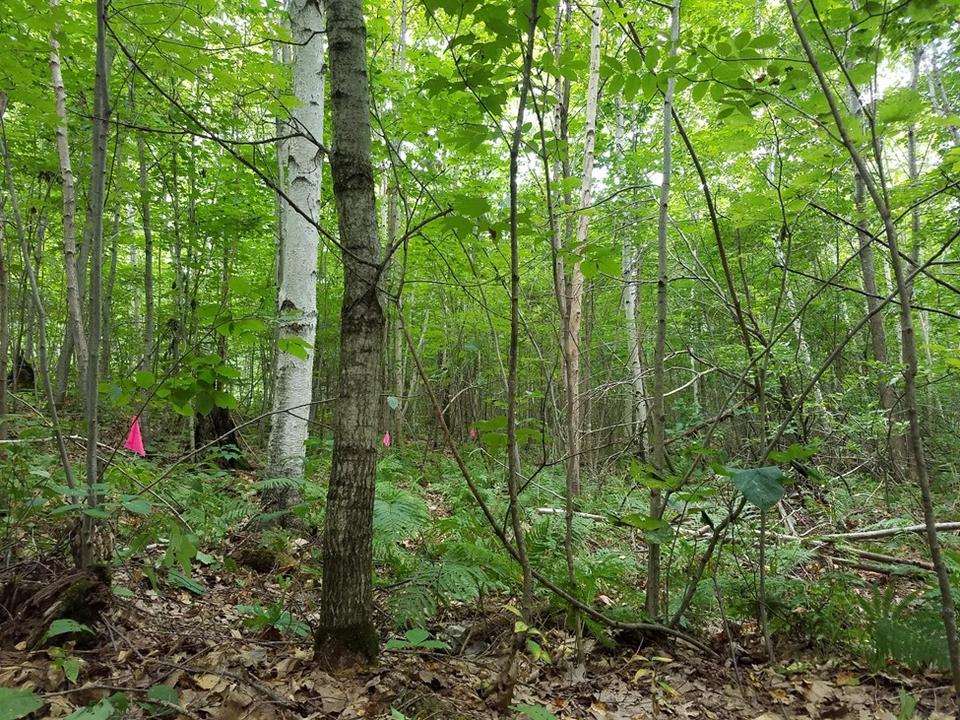
Figure 4: Inside exclosure 2018, photo by Brooke Haworth
Outside the Deer Exclosure
Outside the exclosures, aspen was a persistent component in all height classes, but began to decline in abundance in 2010. In contrast, birch had low abundance in 2004 and 2005 but gained in abundance from 2010-2018. Maple species continuously recruited throughout the sampling period. Red oak declined slightly over the sampling period relative to the other tree species. The shrub composition outside the exclosures from 2004 – 2005 was dominated by hazel and raspberry. By 2010, the shrub layer had a more even distribution of shrub species. However shrub abundance rebounded again in 2018, but with hazel more equally mixed with raspberry and bush honeysuckle.
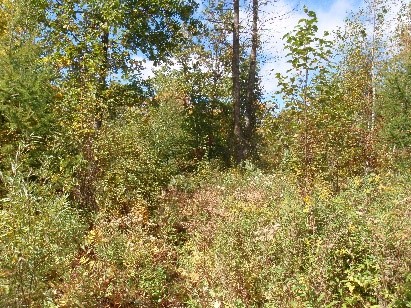
Figure 5: Outside exclosure 2010, photo by Brooke Haworth
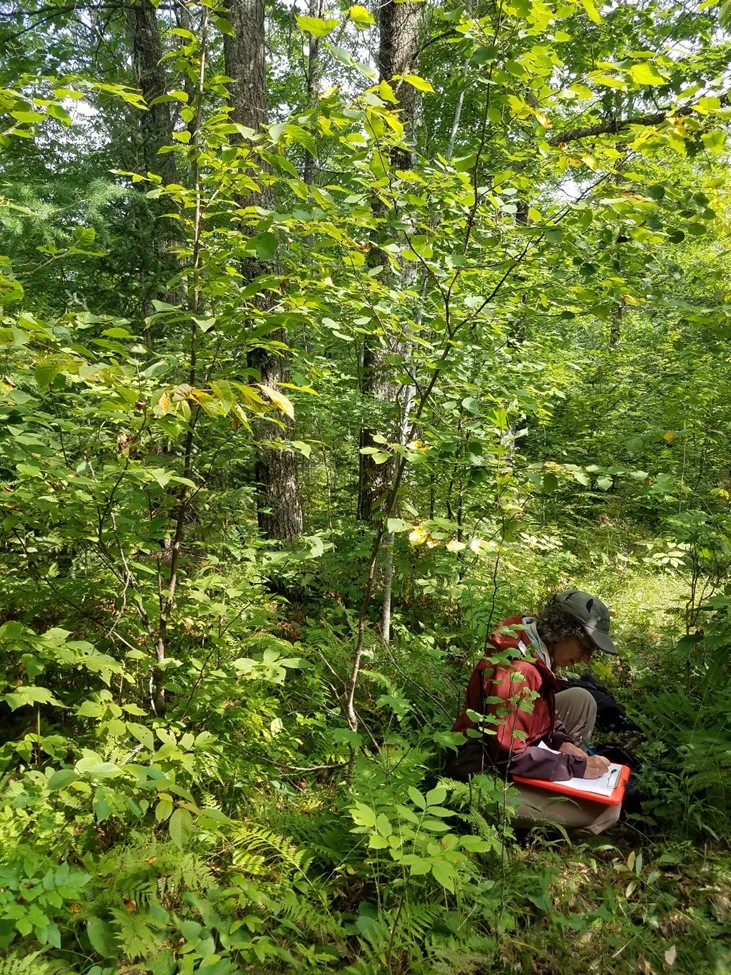
Figure 6: Plot measurement outside exclosure 2018, photo by Brooke Haworth
Plant Species Composition Trends from Relevé Plots
Diversity:
Higher numbers of species occurred on plots outside of the deer exclosures, as ruderal and competitive species were more prevalent. There were no measures of herbivory for the reference relevé plot.
Ground Flora Diversity Indices Outside and Inside Exclosure
|
Year |
Treatment |
S |
H’ |
E |
D |
|
1994 |
CONTROL |
28 |
2.874 |
0.862 |
0.9205 |
|
2004 |
OUT |
38 |
3.229 |
0.888 |
0.9477 |
|
2004 |
IN |
33 |
2.8 |
0.801 |
0.8855 |
|
2010 |
OUT |
37 |
2.593 |
0.718 |
0.7971 |
|
2010 |
IN |
22 |
2.48 |
0.803 |
0.8622 |
|
2018 |
OUT |
53 |
3.581 |
0.902 |
0.9576 |
|
2018 |
IN |
32 |
2.767 |
0.798 |
0.8857 |
Richness and dominance (S=species richness, H’=Shannon Wiener Diversity Index, E=evenness, & D=Simpson’s dominance index)
Successional Growth Changes
Vegetation on differing trajectories
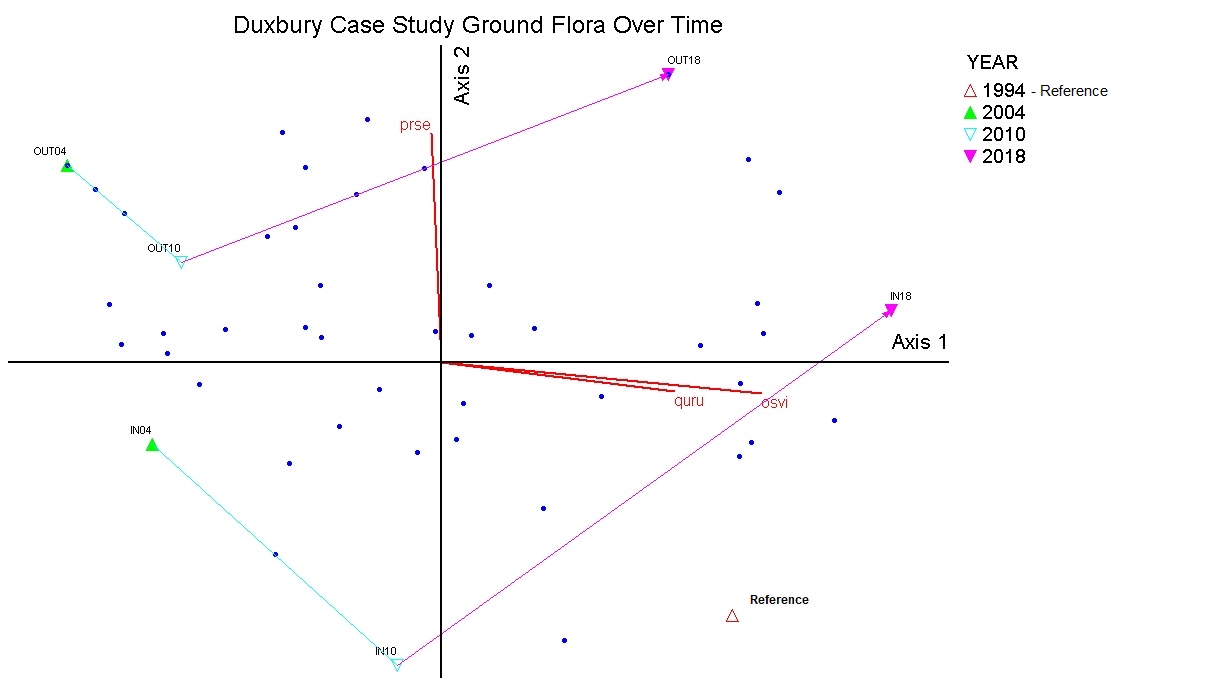
The ordination analysis of the plant composition data lines relevé plots up based on how dissimilar they are from one another. The analysis showed that the ground flora was significantly different as a result of deer exclosure protection. Additionally there was a difference in how plant composition changed over time, with plots protected from deer browsing more closely resembling the 'reference’ MHc26 vegetation yet moving to a different composition. Plant composition outside of the deer exclosures contained a higher proportion of ruderal grasses and aggressive clonal herbs, including species such as Solidago canadensis, Taraxacum officinale, Vicia americana and Bromus ciliatus (see supplemental Table 6.). When looking at the figures of the ordination analysis, correlations of species data with the ordination axes (Kendall’s tau > 0.4) help identify which plants are contributing to patterns seen due to deer exclosure protection and over time. While there are some early growth stage tree species such as aspen persisting, the positive correlations for axis one and overstory trees such as sugar maple (Acer saccharum, Tau=0.6) and ironwood (Ostrya virginana, tau=0.90), as well as red and bur oak (Quercus rubra, tau=0.7 and Quercus macrocarpa, tau=0.5) indicate that there is a transition beginning to happen to a middle growth stage of MHc26. Understory species that are positively correlated to axis one are those typical of mid – late growth stages of MHc26 that tend to persist and compete well in small to medium sized gaps or closed canopies (see Table 5.) Ground flora species that help distinguish plots that were outside the deer exclosure from plots inside the exclosure were more ruderal species as mentioned earlier (see supplemental Tables 7-8). As plant composition in the plots outside the exclosure are less aligned with the 'reference' vegetation of MHc26 it is unclear if they will eventually converge and recover to a less disturbed condition in the future. Plots that are protected from deer herbivory appear more similar to the reference vegetation MHc26 yet are on a unique trajectory.
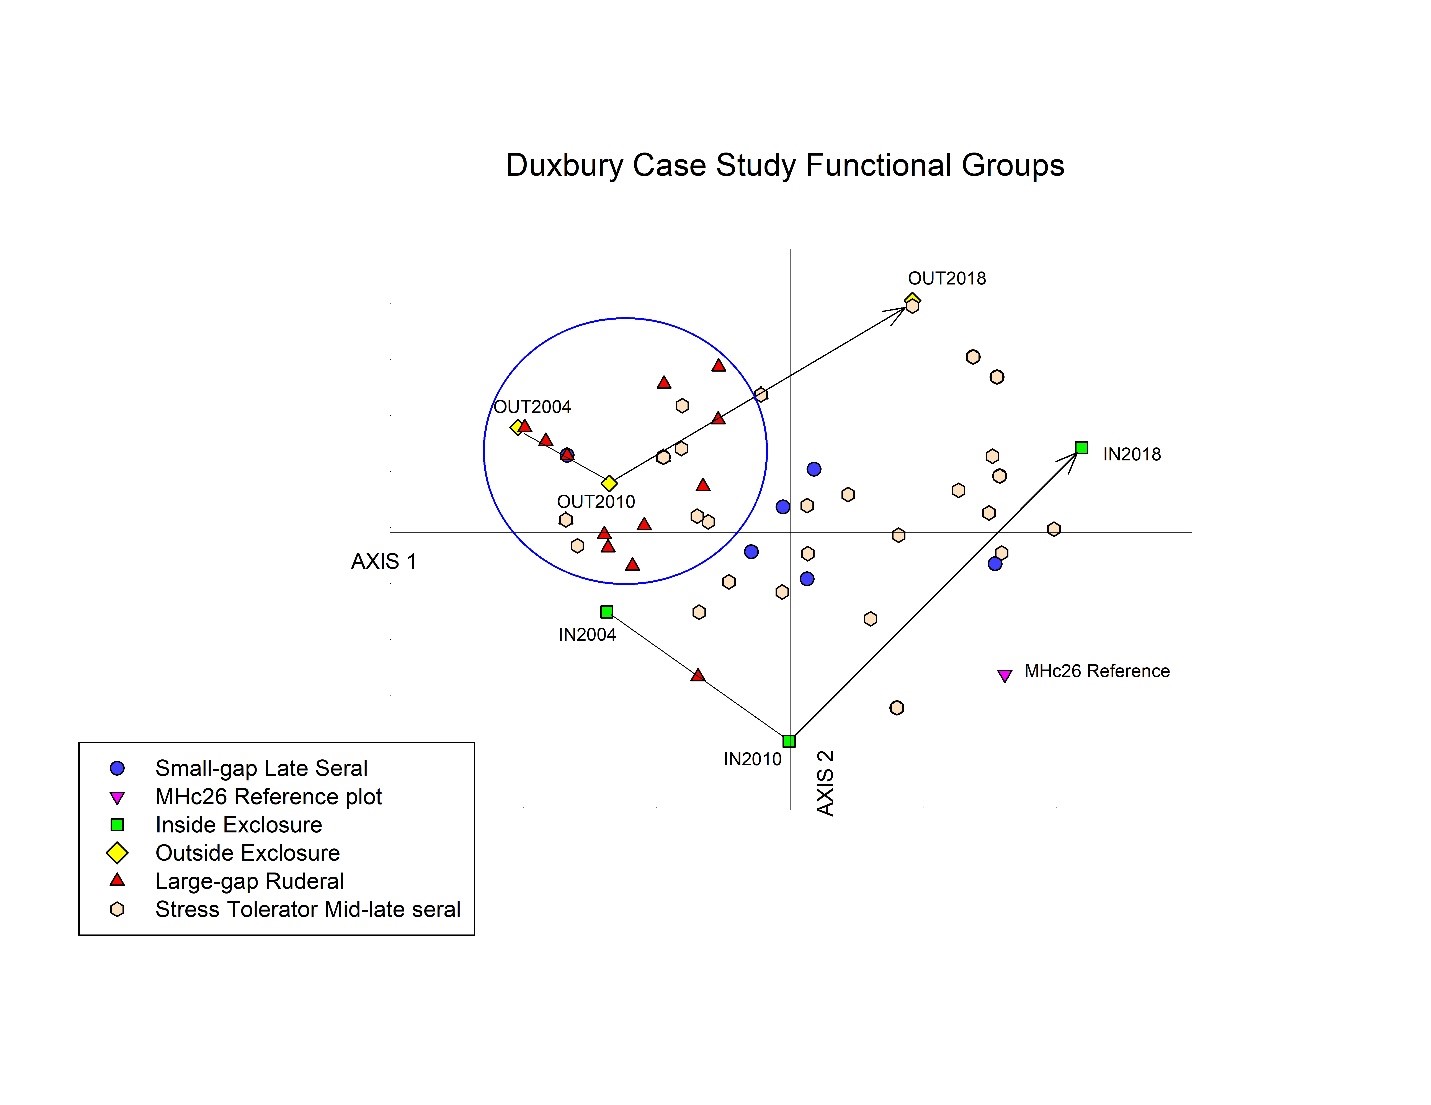
Regeneration Strategies/ Functional Groups
A secondary matrix was constructed within the analysis to explore the vegetation response to deer browse protection, year sampled, and plant functional categories based on autecological traits for successional status, competitiveness and regenerative ability. We used CSR categories defined as: C – competes in place - species adapted to low microclimatic stress and low levels of disturbance, S - stress-tolerating species - adapted to stress in climatic conditions and low levels of disturbance, and R - ruderal species - adapted to more constancy in microclimate but high levels of disturbance. Placing the management practices implemented in this case study within the context of typical disturbance regimes and considering how plants respond to disturbance and compete for resources are useful in designing future manipulation of the sites to maintain biodiversity (Bell et al. 2011). The historical disturbance regime for MHc26 included moderate surface fires, herbivory, and canopy mortality from wind events, insects, and disease that created small to large gaps (MNDNR 2006). Functional traits were assigned based on a review of plant trait databases (USDA-NRCS 2019; Kattge et al. 2011), and relevant literature (Burns and Honkala 1990; Munson et al. 2016; Novakovskiy et al. 2016b; Grime and Mackey 2002). For example, light tolerance, regenerative strategy/dispersal, and habitat preference allow for a rough assignment of categories that describe strategies plants have evolved in response to combinations of stress and disturbance intensity. The CSR categories attempt to integrate both adaptive traits for disturbance (e.g., morphology of roots and shoots, leaf forms, litter requirements, growth rates) and stress created by the variability in climatic edaphic requirements for a plant (Weaver and Grime 2007; Novakovskiy et al. 2016b).
Changes in species composition are in part caused by how plants partition available resources and how they get to and occupy optimal niches, defined by characteristics such as light, moisture, and soil (Runkle 2013; Runkle 1982). Here we use ‘regeneration niche’ categories as they relate to gap size which can be a proxy for amount of light and the availability of an open ground. Small-gap strategists are species that can fill in single-tree or few-tree gaps in the canopy through advance regeneration. Small-gap/large gap strategists are species that may either have a presence adjacent to the gap and/or fill canopy holes through colonization, or can persist with some competition with other species but require more light to attain dominance. Large-gap strategists are species that fill large canopy openings where the previous canopy no longer provides significant cover. These species are aggressive colonizers and generally require disturbed ground and full light.
Functional trait categories used in overlay matrix.
|
Response to disturbance |
Seral Stage |
Regeneration Niche |
Regeneration Strategy |
|
|
C - Comp - holds its space if already present |
Late |
small gaps |
rhizomes, caudex |
|
|
S - Stress - Can compete with occupied space and somewhat good at colonization |
Mid-Late |
small-gap/large gap |
aggressive rhizomatous species and seeders |
|
|
R - Ruderal - gets there easily but needs open space |
Early |
large-gaps |
seeders, or aggressive adventitious roots |
|
Species as indicators
The above correlations of species to the ordination axes are of interest to determine which plant species may be most useful for future monitoring efforts. Future studies would benefit from more replications of this treatment layout across similar NPCs in order to support analyses of significant plant indicators. Other studies have found plant species useful as indicators of disturbance in research on harvest impacts. For example, ruderals were found in areas with higher disturbance and continued to impact regeneration and species composition Berger et al. (2007). Other studies showed impacts to mid-tolerant species such as red oak and white pine from fern competition (Gilliam 2007, George and Bazzaz 2003).
In this case study, it appears that some species have higher competitiveness in disturbed open areas (ruderals and species that colonize paludified soils). Examples include open site colonizers such as grasses (Agrostis spp, Calamagrostis spp, and Bromus spp); species that are clonal and produce many seeds such as Eupatorium perfoliatum and Solidago canadensis; and competitors for light such as ferns like Mattuecia struthiopteris. This result is not unexpected and is similar to results from other studies where ruderal species took advantage of disturbed sites with pressure from herbivory (Wiegmann and Waller 2006). Changes in species composition to more ruderal and competitive species can be long-lasting (Gilliam 2007 and Roberts and Gilliam 2003).
Other notes
The deer exclosure portion of the project was implemented with the guidance of Bill Foss, Eaglehead Field Station- retired, and Doug Hecker, Program Forester, Sandstone Forestry.
In September 2004, deer exclosures were bid out for contract and erected by Vendor’s Dean Peterson, and Arnie Cekalla. Following exclosure installation, Forestry and Wildlife staff requested that the Ecological and Water Resources Division conduct a monitoring study to measure woody species regeneration, browse level and plant composition inside the exclosure and outside the exclosure.
The regeneration and vegetation composition case study was initiated in October 2004 by Hannah Texler, Regional Plant Ecologist with the Division of Ecological and Water Resources (EWR), and Alaina Berger, Ecological Land Classification Implementation Specialist with the Division of Forestry, with the help and support of other Forestry staff.
After 2004, the data collection was conducted by Hannah Texler with the help of many DNR staff from the EWR, Forestry, and Parks and Trails divisions. Follow-up measurements on stand condition and basal area was conducted by Doug Hecker, Sandstone Area Program Forester.
2005 was a good year for acorn production on northern red oak.
Summary / lessons learned / additional thoughts
Our results are similar to other deer exclosure studies (Pendergast et al. 2015) in that there is some recovery of the original species composition but with the addition of competitive ruderal species. Site preparation techniques such as those used in this case study, compounded with deer herbivory, appear to foster more aggressive ruderal species that take stand development into unique structural and compositional arrangements. The shift in species composition to highly competitive ruderal species diminish regeneration of target tree species. Furthermore, whether the plant community will resemble its previous composition and structure may depend upon if ruderal species continue to increase in dominance and subsequently modify the micro-environment in ways that prohibit the successful recolonization of typical species for MHc26. For example, if grasses like Calamagrostis canadensis create impenetrable thatch layers, oak acorns may not have access to mineral soils or if woody species like ironwood or raspberry have formed dense patches, competition for light and soil nutrients could become difficult. Unfortunately mechanical and herbicide site preparation do not completely mimic what repeated surface fires could accomplish in the past to keep the understory open. In some cases heavy mixing of the soil to prepare for planting can exacerbate the situation by releasing the weed seed bank. To further complicate the fate of this forest, future variability in climatic events and herbivory pressure from deer (Royo et al. 2010; Royo and Carson 2006) will continue to shape future plant composition.
There are limitations to this case study as it was not initially designed with replicates or with documenting all competive conditions in mind. While we don’t have complete information on levels of basal area as a surrogate for light conditions - for all years of this particular case study, it is still interesting to note that in 2019, residual basal area was around 30% lower inside the exclosure than within the area outside the exclosure. Given this, you might expect there to be more light loving ground flora within the exclosure, competing with regenerating tree species. However, despite the fact that more light was available inside the exclosure, regenerating tree species and ground flora appears to be transitioning to a middle growth/successional condition. This could be in part due to “invader species” not flourishing as deer were excluded. In trying to moderate the response of light loving ruderal species, keeping greater residual basal cover is a logical choice. However, in this case study, the greater amount of residual basal area outside the deer exclosures did not appear to counteract the impacts that deer herbivory had on the composition of vegetation and survival of regnerating woody species. Our results show that the shift to more ruderal composition is most likely due to a complex interplay of the level of disturbance to the soil, use of herbicides, and how much light was made available. All of these factors can influence how fast the regenerating woody species gained dominance. Deer browse protection allowed the regenerating woody species inside the exclosure to capture soil and light resources rapidly enough to provide shade, moderating conditions for the ground flora (see total basal area was greater inside the exclosure).
In planning future management treatments for this type of site there is a delicate balance of how much canopy to remove to provide the light needed for regeneration of mid-tolerant species. Paying attention to existing plant composition with a focus on those that are going to respond to disturbance is important. Pre-treatment of established recalcitrant species such as ironwood or raspberry may be needed. When implementing the final release cut or when creating large openings there may be a risk in releasing problem species (i.e., seed banking plants such as blackberry and weeds such as horseweed and thistle ). Fine tuning the amount of basal area to remove under current deer herbivory levels can be especially tricky as sites often have inclusions of wetter NPCs. While fire played a role in this forest it was not catastrophic and likely patchy in extent, leaving a significant amount of the sites duff layer intact. If the goal is to transition the site away from early seral growth stages it could be useful to reserve legacy areas that provide seed and vegetative sources of mid- to shade-tolerant species while diminishing the success of pioneering species such as aspen. The results of the exclosure case study do show a benefit of using deer herbivory protection along with supplemental planting to augment species composition.
Supplemental content
Regeneration tables and graphs for the case study
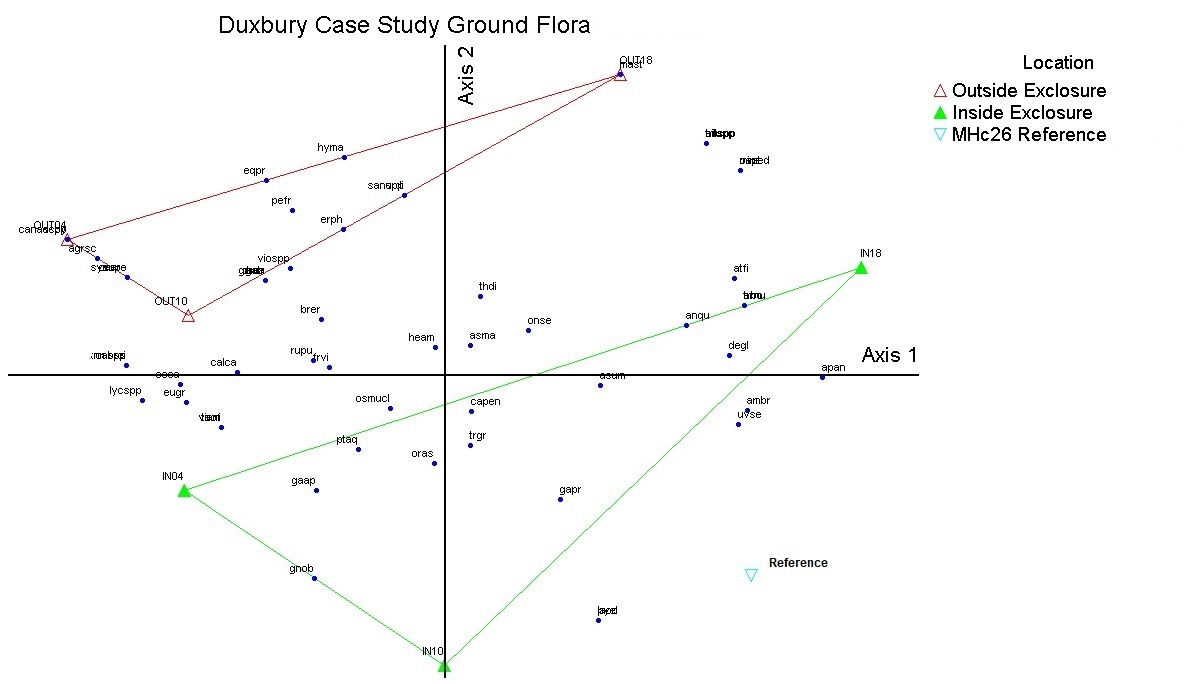
NMS plots by location
NMS plots over time
Ordination with functional groups
Species correlation tables
Bibliography