44.600222, -92.625645
Overview
This case study is a review of the results of 30 years of regeneration efforts on a bottomland hardwoods stand in the Mississippi River floodplain system in southeastern Minnesota. The native plant community silvicultural strategies on this site were:
- Large gap: maintain a stand as would selective windthrow involving patches of similarly sized trees by removal of canopy trees in large gaps.
- Small gap: maintain a stand as would natural senescence, disease, beaver cutting, or physical battering to create small-gap habitat.
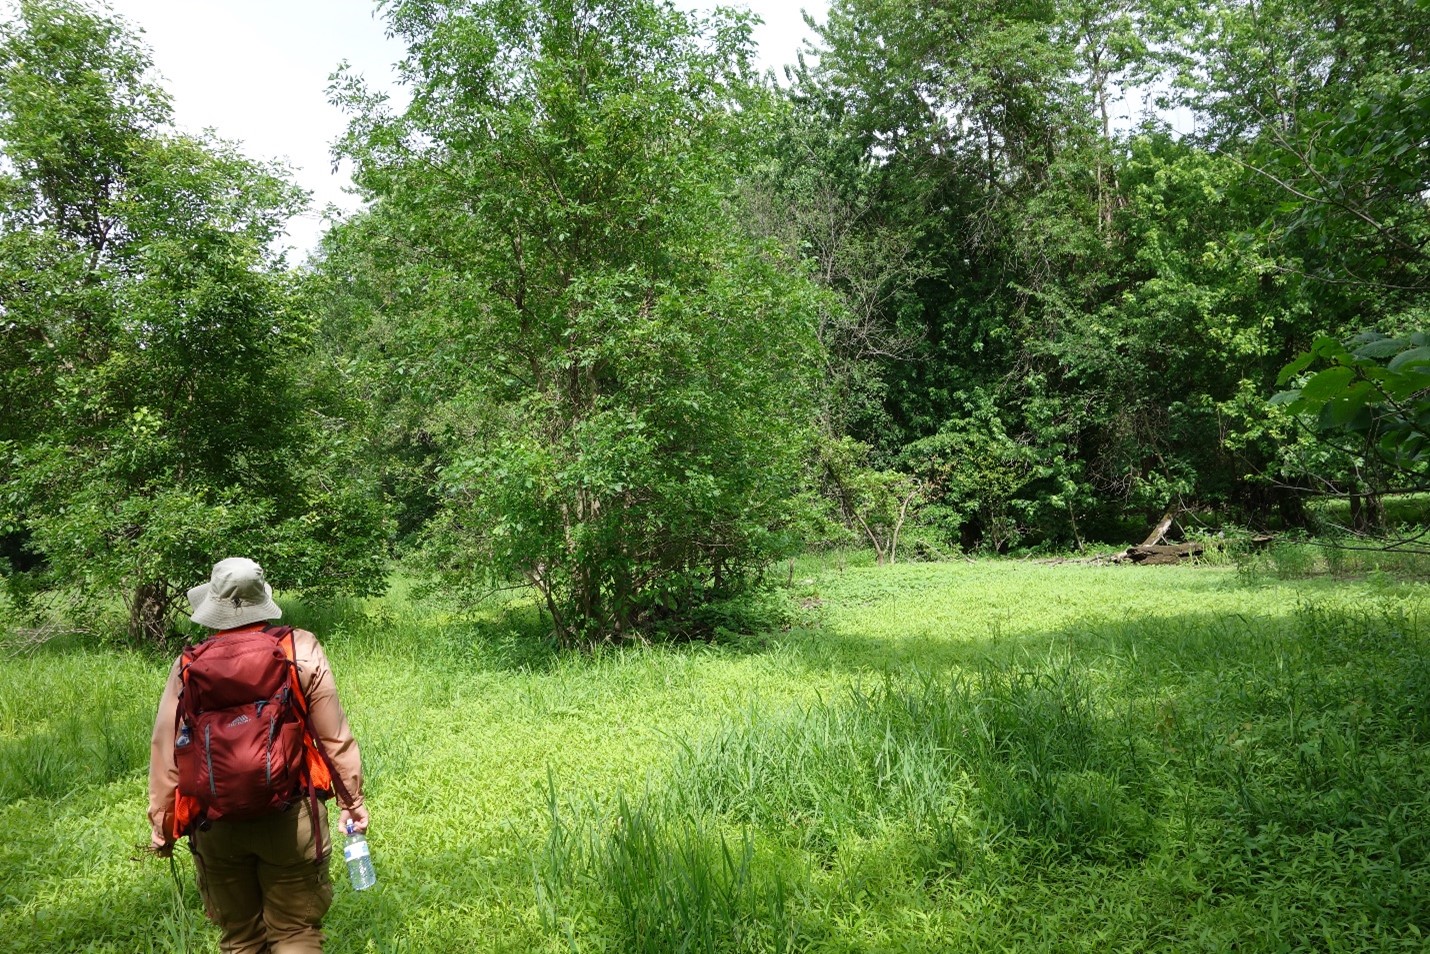
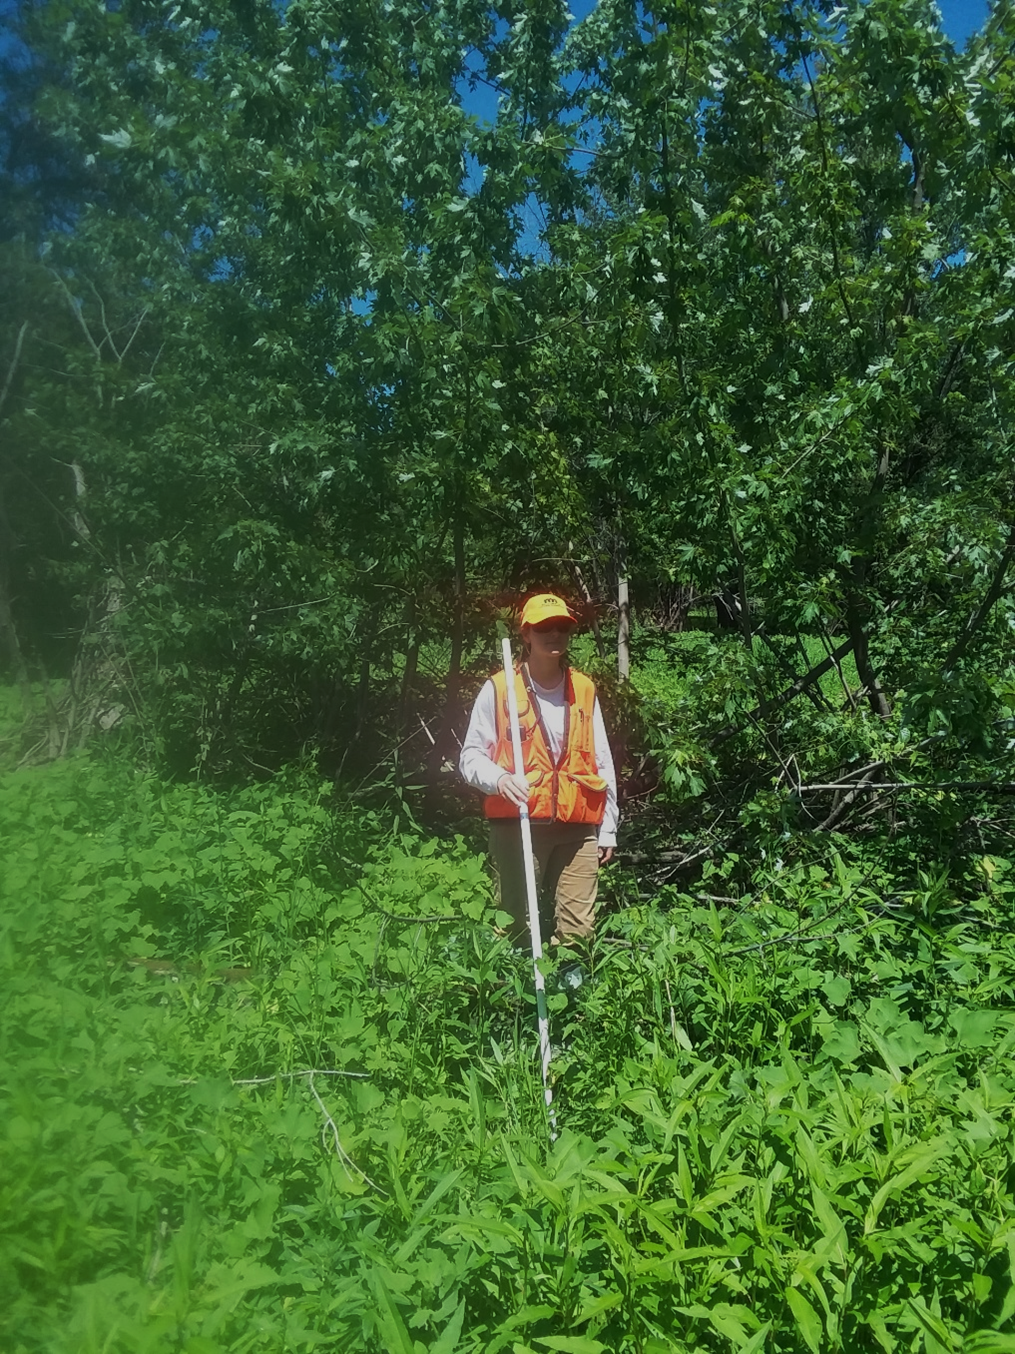
Figure 1: July 2020. Michelle Martin in an open area of the stand with several small patches of regeneration
In addition to the large and small gap strategies, part of the stand was treated with a clearcut with reserves prescription.
Both natural and artificial regeneration were used in the study area.
Much of the lowland hardwood forest acreage in this region is reaching biological maturity and is in need of active management to maintain forested condition. Yet it has proven very challenging to consistently regenerate lowland hardwood stands here.
One of the important facets of the study is that there has been some regeneration of silver maple since the initial harvest and regeneration efforts 30 years ago. A key question we wanted to examine: Why did regeneration get established in some locations, but not on other portions of the site?
As part of the study, we used LiDAR to see if we could determine whether subtle differences in elevation could be part of the explanation for regeneration inconsistencies. We also collected information on reed canarygrass competition to see if we could learn anything about its impacts on tree regeneration for this site.
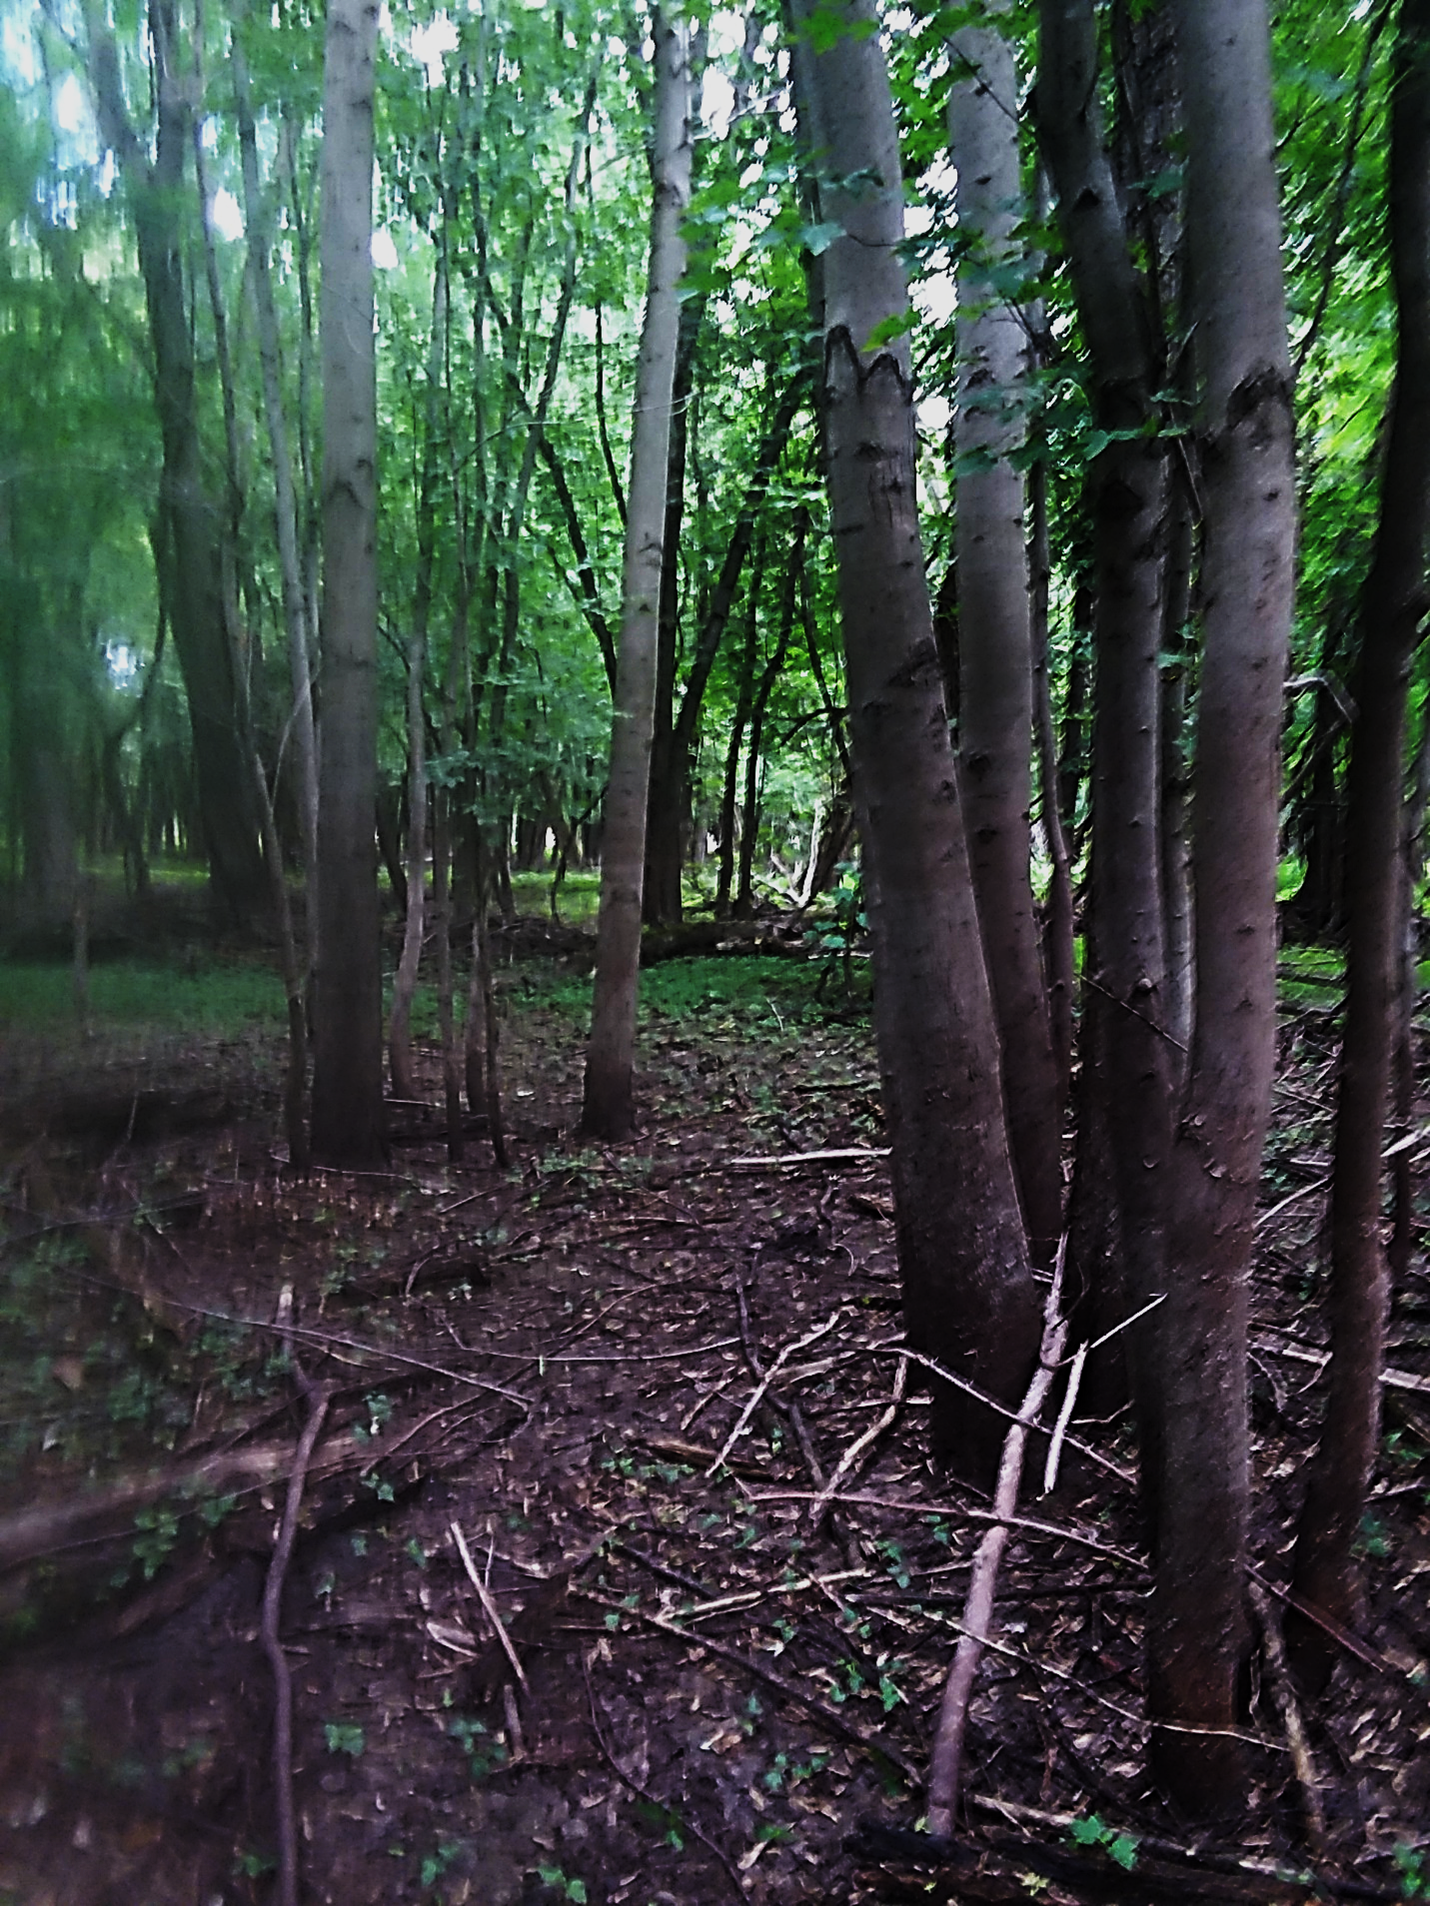
Figure 2: July 2020. 20 to 30 year old silver maple regenerated post-harvest
Silviculture Objective(s)
- Maintain floodplain forest for habitat, ecological services and economic reasons
- Regenerate the mature portion of the stand to a young stand of similar composition
- Improve the health and vigor of the younger portion of the stand
- Improve timber quality and value
Pre-treatment stand description and condition
Stand establishment and management history:
The study site is located in the floodplain of the Mississippi and Vermillion Rivers. The pre-harvest condition in 1990 was a mixture of floodplain forest of at least two different ages and variable densities. The site also has non-forested sections with annual floodplain vegetative cover, including sedges and reed canary grass, as well as some marshy inclusions. The site had a history of use as pasture and woodlot prior to the state obtaining the property from a private landowner in the late 1970s
Pre-treatment species composition:
Silver maple was by far the dominant overstory species in 1990. Green ash was the next most prevalent, followed by a very small components of American elm, black willow, boxelder and cottonwood.
Table 1. 1990 timber sale appraisal of sawlog volume of merchantable trees with stems > than 12 inches DBH (board feet)
Species Volume
Silver Maple 83,190
Green Ash 9,000
Miscellaneous Hardwoods: 2,000
Pre-treatment forest health issues:
Elm was most likely a larger component of the stand historically, but due to Dutch elm disease in the 1960s and 1970s, it had become a minor component by 1990.
Landowner objectives/situation:
While specific objectives vary from parcel to parcel, lands under the administration of DNR-Forestry are managed in alignment with Section Forest Resource Management Plans (SFRMP) to ensure that state forest management activities meet statewide goals for ecological protection, wildlife habitat, timber production, and cultural/recreational values. The DNR assembles teams from the Divisions of Forestry, Fish & Wildlife, and Ecological & Water Resources who work with partners and the public to develop SFRMPs.
Minnesota DNR’s specific objectives for this site and surrounding area are excerpted from the document “Blufflands/Rochester Plateau Subsection Forest Resource Management Planning ADDENDUM: Vermillion Bottoms and Lower Cannon River Area High Biodiversity Area Management Plan – December 2002”: Maintain and regenerate native plant communities and the plant and animal species that reside in the area. The intent is to have timber age classes spatially distributed to provide habitat both now and in the future for adapted flora and fauna to survive in this area. Processes that mimic the disturbances that helped to establish and maintain these communities will be used to achieve this goal.
The goals of biodiversity protection, timber management, recreation, and wildlife management will all be included in management decisions to achieve this goal. As new research or management techniques become available, they may be incorporated into management practices prescribed in this plan to achieve the long-range goals.
Silviculture Prescription
Table 1: Silvicultural treatments implemented
| Treatment | Date | Description | Acres Treated |
| Silvicultural assessment | 1990 | Assessment to determine silvicultural strategies to maintain, improve and regenerate the stand | 31 |
| Clearcut with reserves harvest | Winter 1990/91 | Harvest to open up the site in preparation for natural and planted seedlings to thrive in full sunlight | ~18 |
| Thinning (combination of large and small gap) harvest | Winter 1990/91 | Larger, poorly formed and less healthy trees were removed to open more room for crowns of pole/small sawlog-sized trees in good condition. The objective on this part of the stand with younger trees was to improve health and vigor. | ~13 |
| Planting | Fall 1991 | Hand plant an estimated 3000 silver maple and 3000 green ash seedlings | ~18 |
| Post-sale weeding, killing of competing undesirable trees | Growing season, 1991 | Kill the few competing boxelder and elm trees by girdling and applying herbicide to girdle wound | 31 |
| Seedling release | Late spring 1993 | Spot herbicide spray to release seedlings from annual vegetative competition | ~18 |
| Field Trial: Planting Large (4’ tall) Stock | Approximately 2000 | Hand planted an unknown number (probably less than 100 each) of 4’ tall green ash and silver maple private nursery seedlings | ~1 |
What actually happened during the treatment
Seedlings flooded during a large portion of the 1993 growing season:
The prescription appeared to be working as planned, until the summer of 1993. Field checks after a late spring spot release treatment showed planted and natural seedlings that were growing well after one growing season. It rained a lot in late June, resulting in flooded conditions with standing water over the site for the rest of the summer and fall, flooding the young seedlings. Unfortunately, we do not have post-flood regeneration check records that would document the condition of seedlings in 1994 or beyond.
Post-treatment assessment
For the younger portions of the stand treated with a small gap or thinning harvest, the main objective of improvement of stand health and vigor was achieved.
On this 13-acre portion of the stand, tree crowns have filled in on the released trees, resulting in good growth and health of the stand. At the time of writing this case study in 2021, the area is near biological maturity and ready for another harvest.
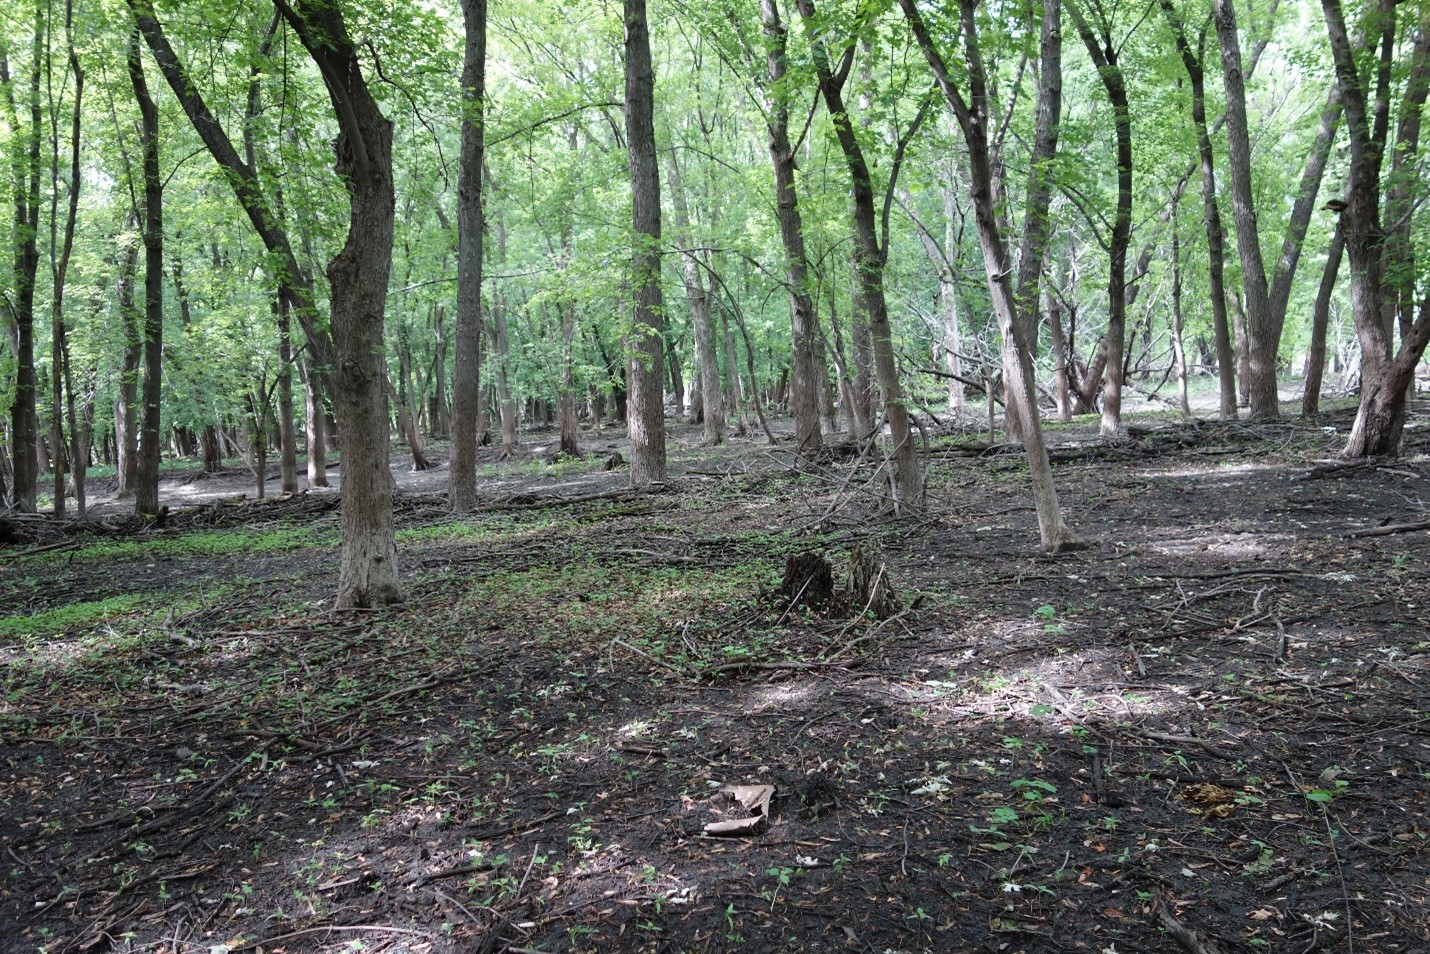
Figure 3: July 2020. A portion of the stand that was thinned in 1991
There were mixed results for portions treated with large gap and clearcut with reserves harvest.
Portions of the 18-acre clearcut area have regenerated since the harvest and objectives to regenerate the stand have been achieved. Somef of the openings created during the 1990 harvest have now regenerated with silver maple.
However, as of 2020, there are also significant portions of the stand that have failed to regenerate to trees and have therefore not achieved regeneration objectives. These areas will need continued efforts to achieve a forested condition. Note: Some of the area with no regeneration in 2020 was open and treeless pre-harvest, but some was forested pre-harvest.
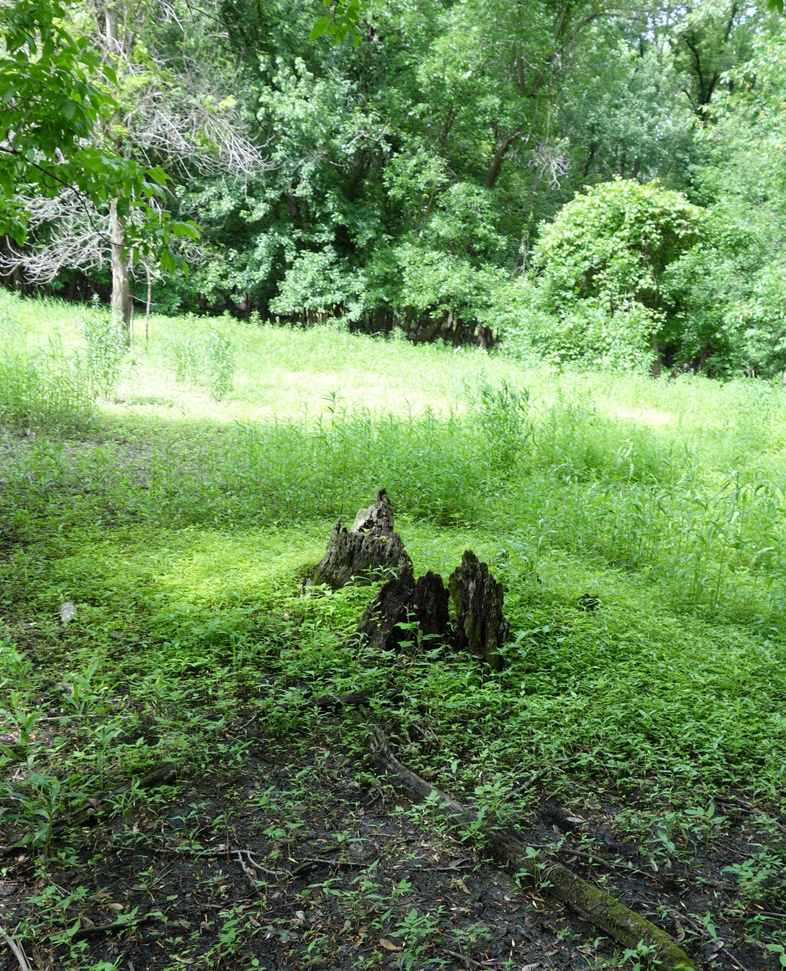
Figure 4: July 2020. 30 year old stumps in a portion of the stand that has so far failed to regenerate to trees
Overstory
Tree densities and sizes are variable.
As shown in Table 2, randomized grid plots indicate an overall average basal area of 51 ft2, but the stocking level, structure and age of tree cover is quite variable. As can be seen in the 2019 aerial photo (Figure 2), some areas have full tree cover, with only scattered cover on other portions of the site. In some of the marshiest portions, there is no tree cover at all.
Table 2: Tree basal area (feet2/acre) and frequency on randomized grid 10 factor BA plots (%) by species and size class in 2020. Note: Trees in the 5" to 10" DBH size class have regenerated post-harvest. Trees in the 10" to 15" DBH size class are a mixture of harvest residuals and post-harvest regeneration. Trees greater than 15" DBH are all harvest residuals.
| Diameter Class | ||||
| Species | 5" to 10" DBH | 10" to 15" DBH | 15" to 20" DBH | > 20" DBH |
| Silver Maple | 2.68/20% | 7.8/29% | 11.5/41% | 19.3/46% |
| Green Ash | 1.7/12% | 0.7/7% | 1.5/10% | 2.9/15% |
| Elm | 2.0/15% | 1.0/7% | 0.0/0% | 0.0/0% |
| Total Average BA: 51 |
Several lowland hardwood species are present, with silver maple predominant
As shown in Table 3, silver maple is by far the predominant species present, followed by green ash and elm.
Table 3: Tree species relative dominance on randomized grid 10 factor BA plots in 2020
| Species | Species Relative Dominance (%) |
| Silver maple | 81% |
| Green ash | 13% |
| Elm | 6% |
| Total | 100% |
As can be seen in Table 2 above and Table 4 below, the site contains a range of tree sizes. Some are harvest residuals, and some have regenerated after harvest activity. To distinguish which trees probably originated post-harvest, we collected tree data by diameter class. While not a perfect system because the 10” to 15” DBH size class contains a mixture of pre-harvest residual and post-harvest regenerated trees, it does provide useful information. We estimate that the vast majority of trees below 10” DBH have originated since the initial harvest activity. The large majority of trees over 15” DBH are harvest residuals. The 10 to 15” DBH size category contains a mixture of harvest residuals and trees regenerated post-harvest.
Regeneration
Regeneration is dominated by very small silver maple seedlings but stocking varies widely
As noted above, most of the trees established since the harvest activity in 1991 are now below 15” DBH in size.
Table 4: Trees per acre and plot frequency (%) for trees less than 5” DBH by species and size class in 2020. Note: All trees less than 5” DBH have regenerated post-harvest.
| Size Class | ||||
| Species | < 1 foot in height | >1 foot in height and < 1”DBH | > 1” DBH and < 3” DBH | 3” to 5” DBH |
| Silver Maple | 2031/83% | 52/5% | 21/7% | 6/7% |
| Green Ash | 21/7% | 7/2% | 2/5% | 2/5% |
| Elm | 5/7% | 0/0% | 2/2% | 2/5% |
| Total stems/acre | 2057 | 59 | 25 | 10 |
Silver maple regeneration and elevation
We used LiDAR derived elevation of our plot locations to assess if regeneration success or failure appeared to be correlated with slight variations of elevation found on the site. Our hypothesis was that higher sites would be flooded for less time during any given growing season and therefore be more likely to support tree regeneration survival and growth. This makes intuitive sense, and our data does show that, on average, plots that we assess as having established tree regeneration are on slightly higher ground.
- Average elevation of plots with probable post-harvest regeneration: 672.877 feet.
- Average elevation of plots without probable post-harvest regeneration: 672.141 feet.
However, as shown in table 5, some well-established regeneration is on relatively low areas.
Table 5: Elevation of randomized grid plots and selected additional points with established post-harvest silver maple regeneration, and highest and lowest elevation recorded on all plots. Notes: Waypoints 1-11 are locations of randomized grid plots that coincided with good silver maple regeneration. Waypoints A-J are selected additional points of silver maple regeneration patches.
| Waypoint | Elevation (feet) |
| 1 | 673.218546 |
| 2 | 673.595810 |
| 3 | 674.658819 |
| 4 | 673.438367 |
| 5 | 673.070864 |
| 6 | 673.585998 |
| 7 | 672.650947 |
| 8 | 672.342517 |
| 9 | 672.293307 |
| 10 | 672.647643 |
| 11 | 671.502633 |
| A | 672.274132 |
| B | 671.897518 |
| C | 672.035238 |
| D | 672.228378 |
| E | 672.209352 |
| F | 672.178066 |
| G | 672.020920 |
| H | 672.027781 |
| I | 672.558785 |
| J | 671.795494 |
Highest elevation recorded on site | 674.658819 |
Lowest elevation recorded on site | 671.026947 |
NOTE: Error estimates for the Lidar data are about 0.35 ft when compared with DNR ground points; and about 0.5 ft accuracy in forested areas fully covered by trees.
Another thought was that perhaps higher elevation relative to the area immediately adjacent to the patch is more influential than highest elevation over the entire large site. This may indeed be a factor, but we were unable to discern a clear pattern to support that hypothesis in all, or even most, cases. By field observation, most of the areas with good regeneration did not appear noticeably higher than the immediate surrounding area with little or no regeneration. Additionally, as shown in Supplemental Figure 2, 1-foot contour elevation data does not indicate a clear pattern of a significant rise in elevation for our random plots with post-harvest regeneration, compared to the immediate surrounding area.
Silver maple regeneration and reed canary grass competition
We estimated percentage of reed canary grass cover for each of our random plots. We were surprised that reed canary grass averaged less than 1% of total cover, and that only 4.9% of our plots had any reed canary grass cover present. The levels we observed indicate that in 2020 it is not a major impediment to tree establishment on a large majority of the site.
There is some spotty mortality on silver maple
We observed some dieback and mortality on silver maple during our 2020 field visits, as shown in Figures 5 and 6. It appeared to be largely confined to the edges of the more open areas adjacent to the large flowage running through the approximate middle of the study area. There was intermittent dieback and mortality in some of the roughly 70 to 90 year old overstory trees, and also in some of the patches of 10 to 20 year old regeneration. Dieback and mortality in bottomland hardwoods often is delayed after major flooding events. Abundant mortality on the site first appears on 2017 imagery and is probably a result of extremely high precipitation during the growing season in 2016. For Goodhue County, April through October 2016 ranked third highest for precipitation going back to 1895 (Minnesota Climate Trends). Abundant mortality also appeared on the site in the 2019 imagery. Some of this mortality may have still been from the flooding that undoubtedly occurred in 2016, but it also likely occurred from flooding that happened in 2019. April through October 2019 ranked fifth highest for precipitation going back to 1895 (Minnesota Climate Trends),
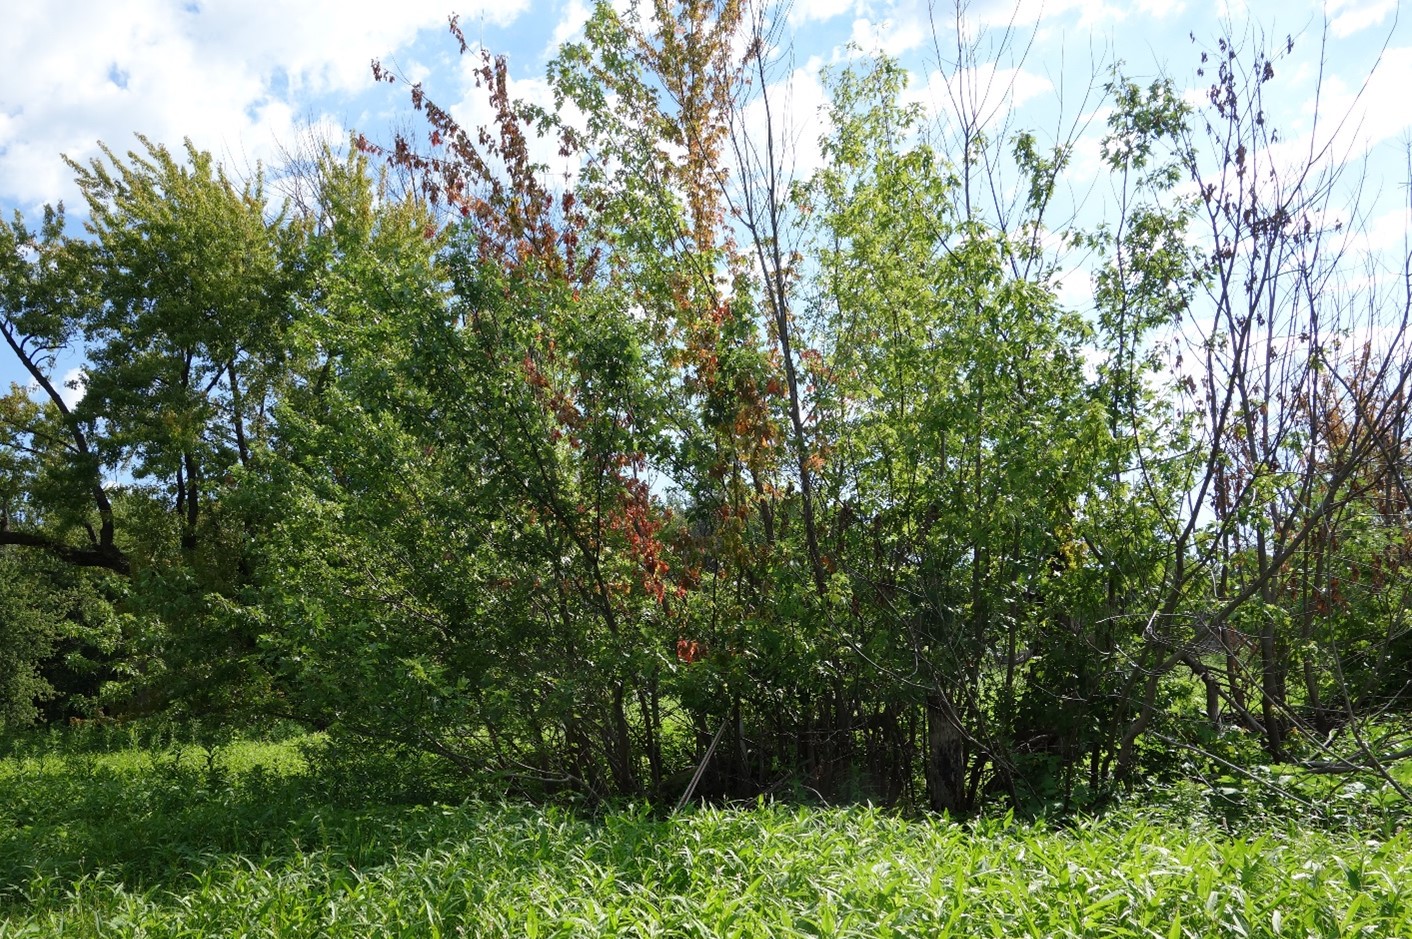
Figure 5: July 2020. A patch of 10 to 15 year old silver maple regeneration showing some stress and dieback
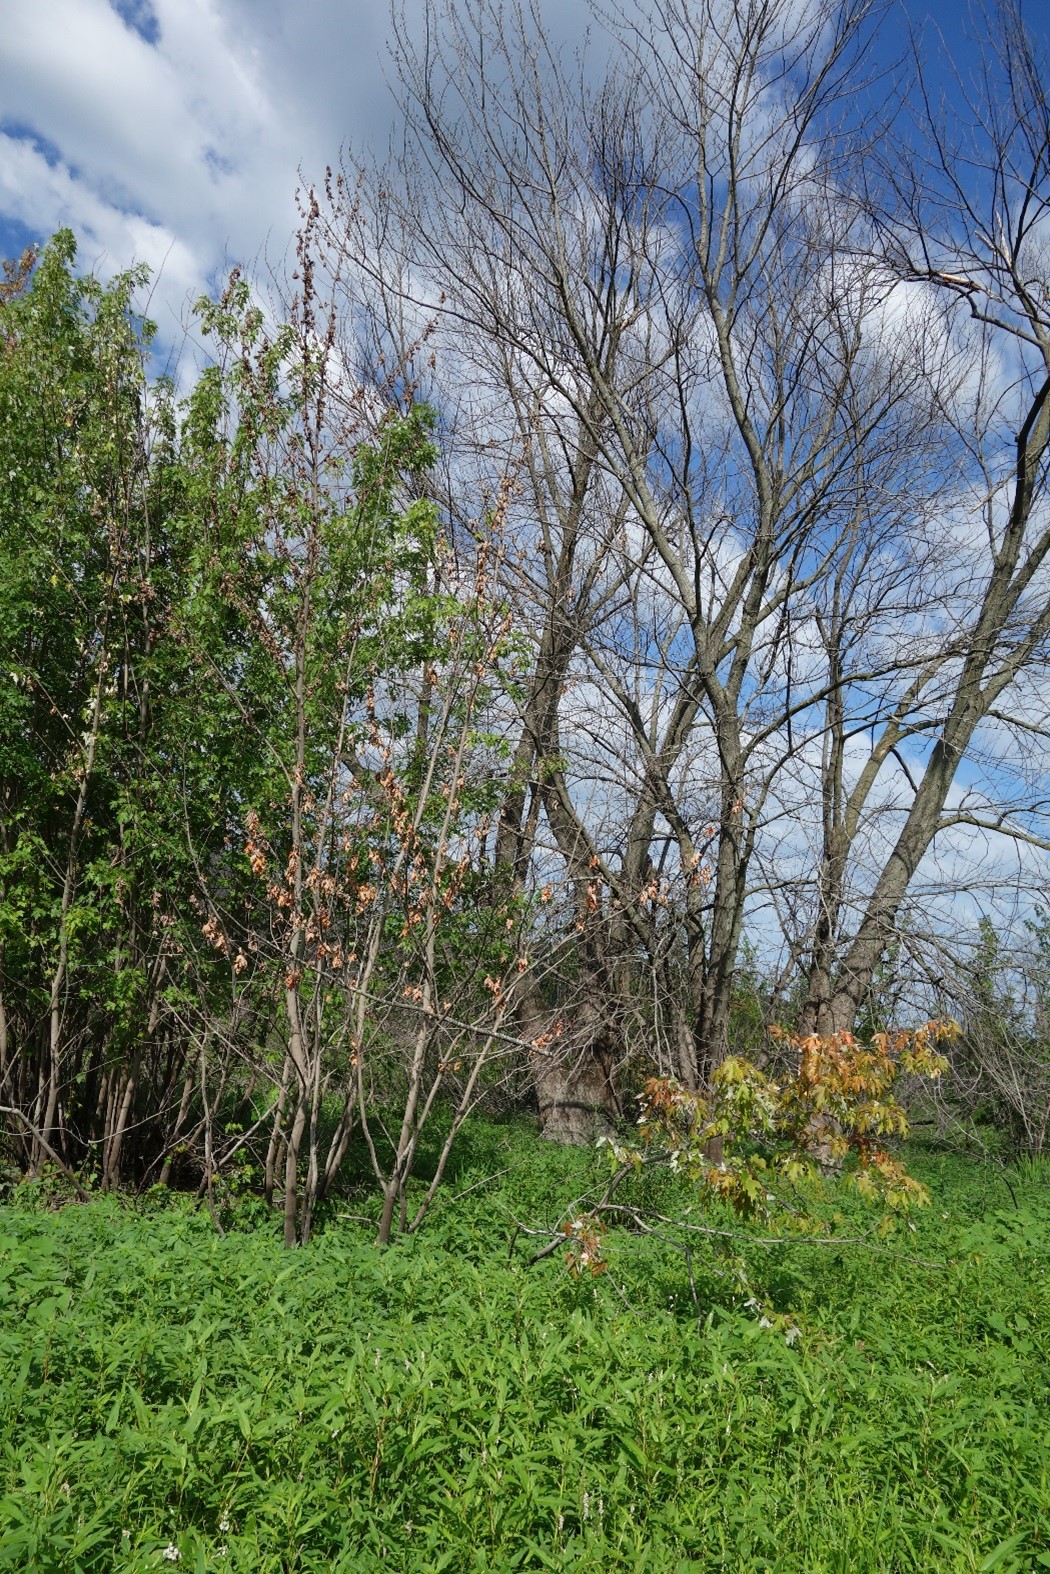
Figure 6: July 2020. Patchy silver maple mortality on some young and old trees surrounding the flowage
2022 case Update: following up with more soil samples
What could be causing differences in regeneration success?
As documented in several case studies, success in achieving silver maple regeneration and recruitment to larger size classes has been highly variable. There were patches of successful regeneration and recruitment, but also significant portions of each site with little to no recruitment of silver maple regeneration.
We looked at variables that might help explain the differences in regeneration success, including different silvicultural treatments, elevation, and level of reed canarygrass competition. None of those factors consistently explained regeneration success differences.
We took soil samples to examine the possibility that soils could be a factor
We also postulated that one of the reasons for the inconsistent recruitment success might be differences in soils. We had taken 3 soil samples on another Mississippi River bottomland site in 2019 (“Flynnville” site) – 2 from areas with good silver maple regeneration and 1 from an area with no silver maple regeneration. Results were inconclusive. There were some minor differences between the samples, but nothing significant enough that we felt could impact regeneration and recruitment success. We felt that perhaps more samples would help clarify whether we could identify discernable regeneration success differences due to soils.
We took 4 more soil samples in June of 2022. Samples were taken in areas with good silver maple regeneration and recruitment as well as places with no silver maple recruitment.
We found minor soil variability, but nothing that we felt could help explain differences in regeneration success.
We were interested in any differences that might help explain regeneration variability. We were especially interested to see if we could find a significant layer of sand within the first 5 feet of the profile that might help explain patches of regeneration success due to being a more hospitable medium for seedling establishment and early growth due to better drainage. There was a small amount of surface sand at sample 3, but it did not seem like it was nearly enough to have had a significant impact.
There was some other modest variability between the samples, but none that we feel would help explain different levels of regeneration success. See Figures 2022-1 thru 2022-6.
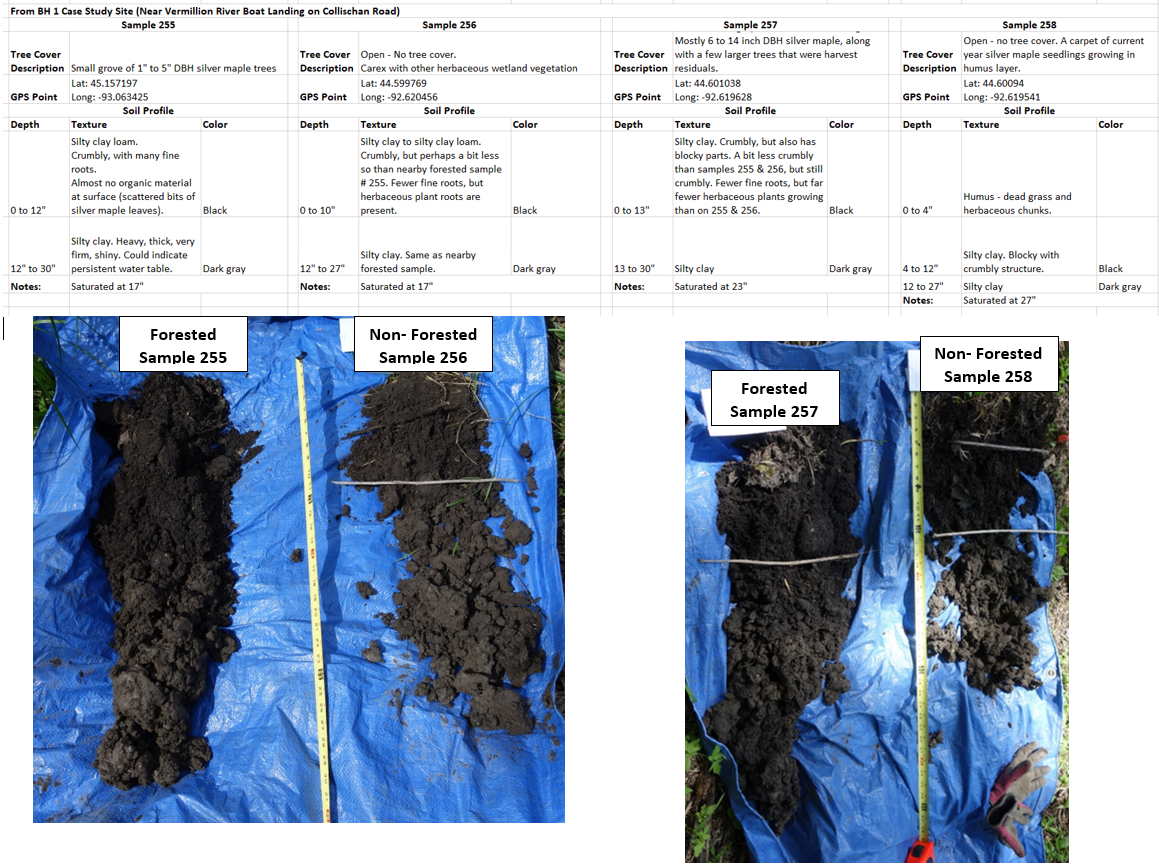
Figure 2022-1: Soil notes and sample photos from the Vermillion River boat landing site
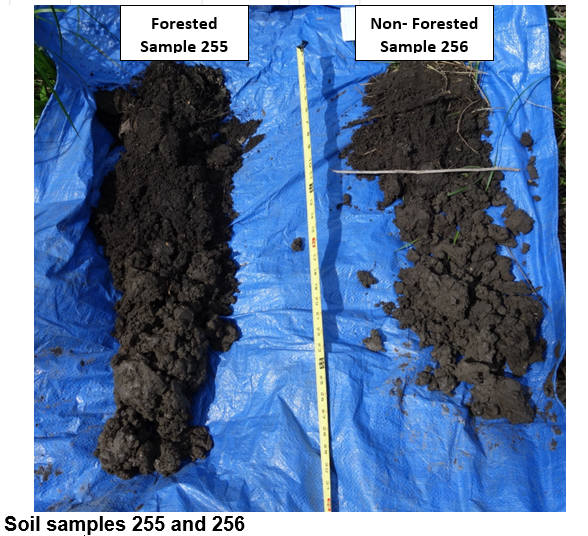
Figure 2022-2: Soil samples 255 and 256 from the Vermillion River boat landing site
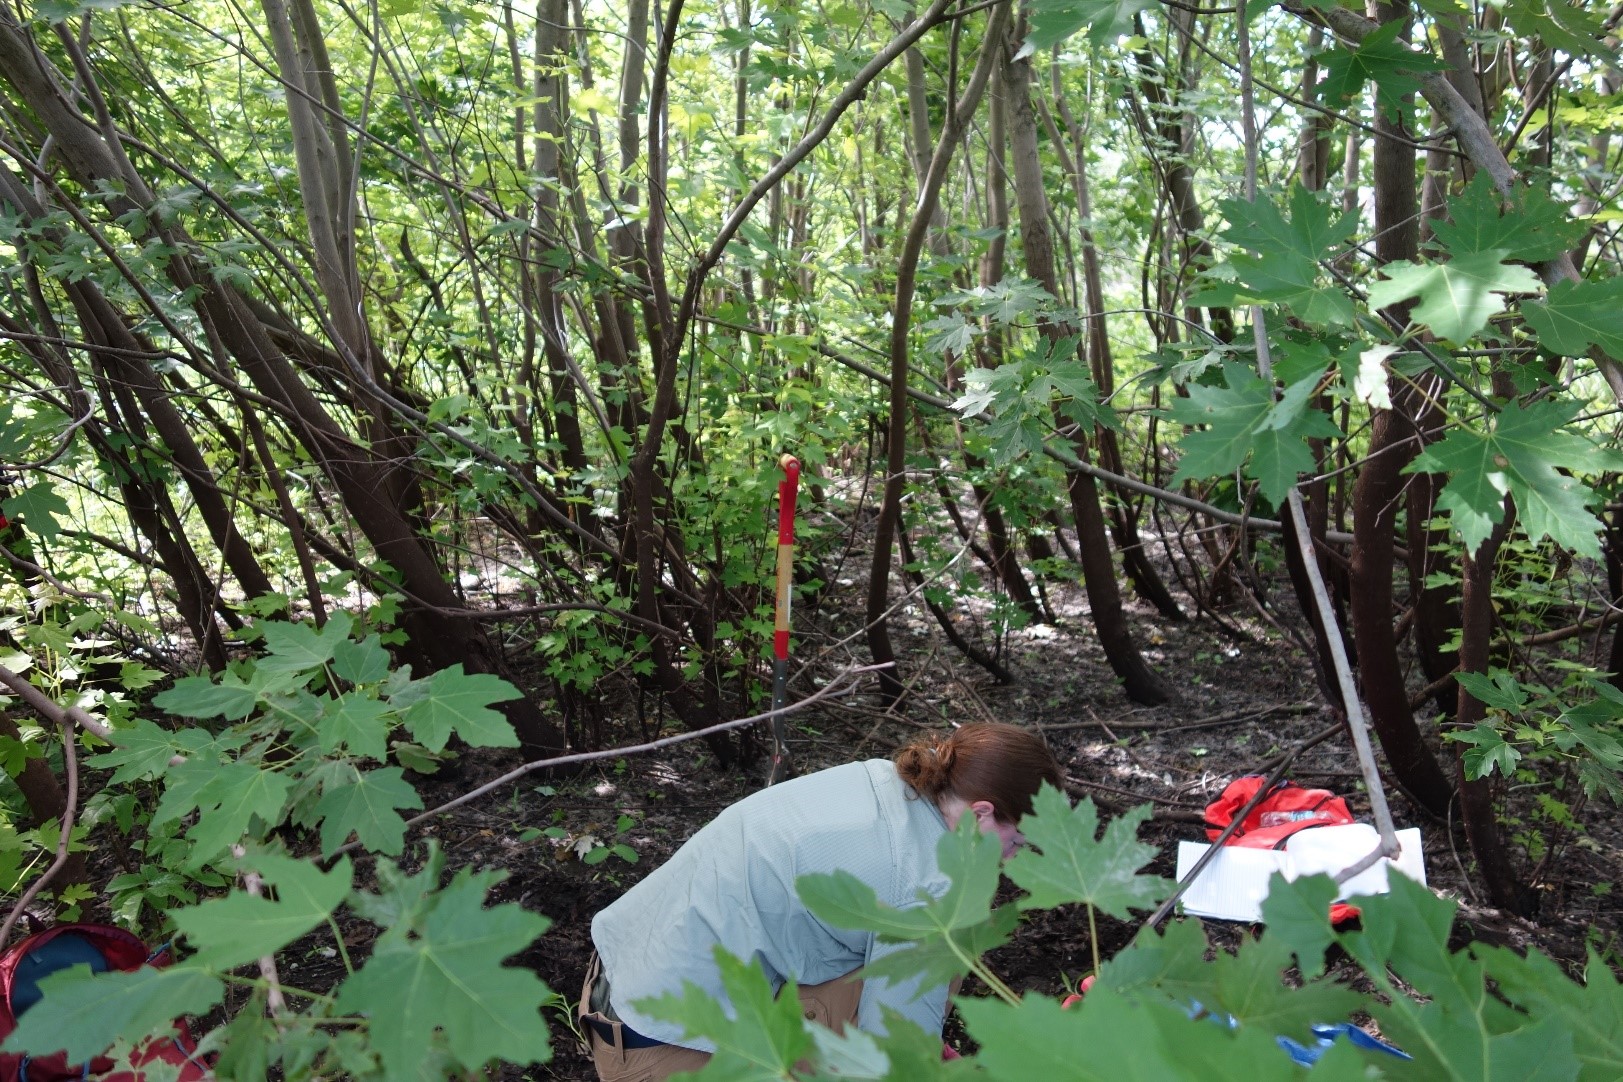
Figure 2022-3: Conditions on the Vermillion River boat landing site at sample plot 255 of young forest with excellent silver maple regeneration
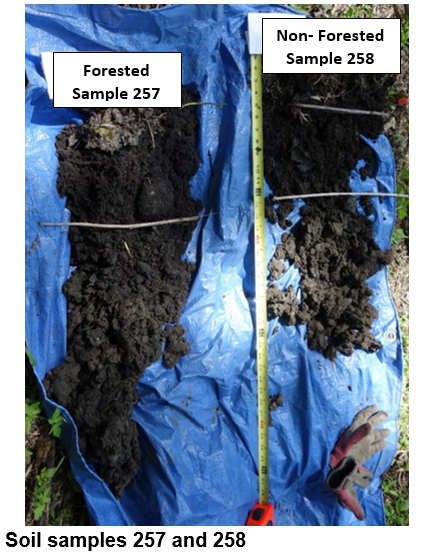
Figure 2022-4: Soil samples 257 and 258 from the Vermillion River boat landing site
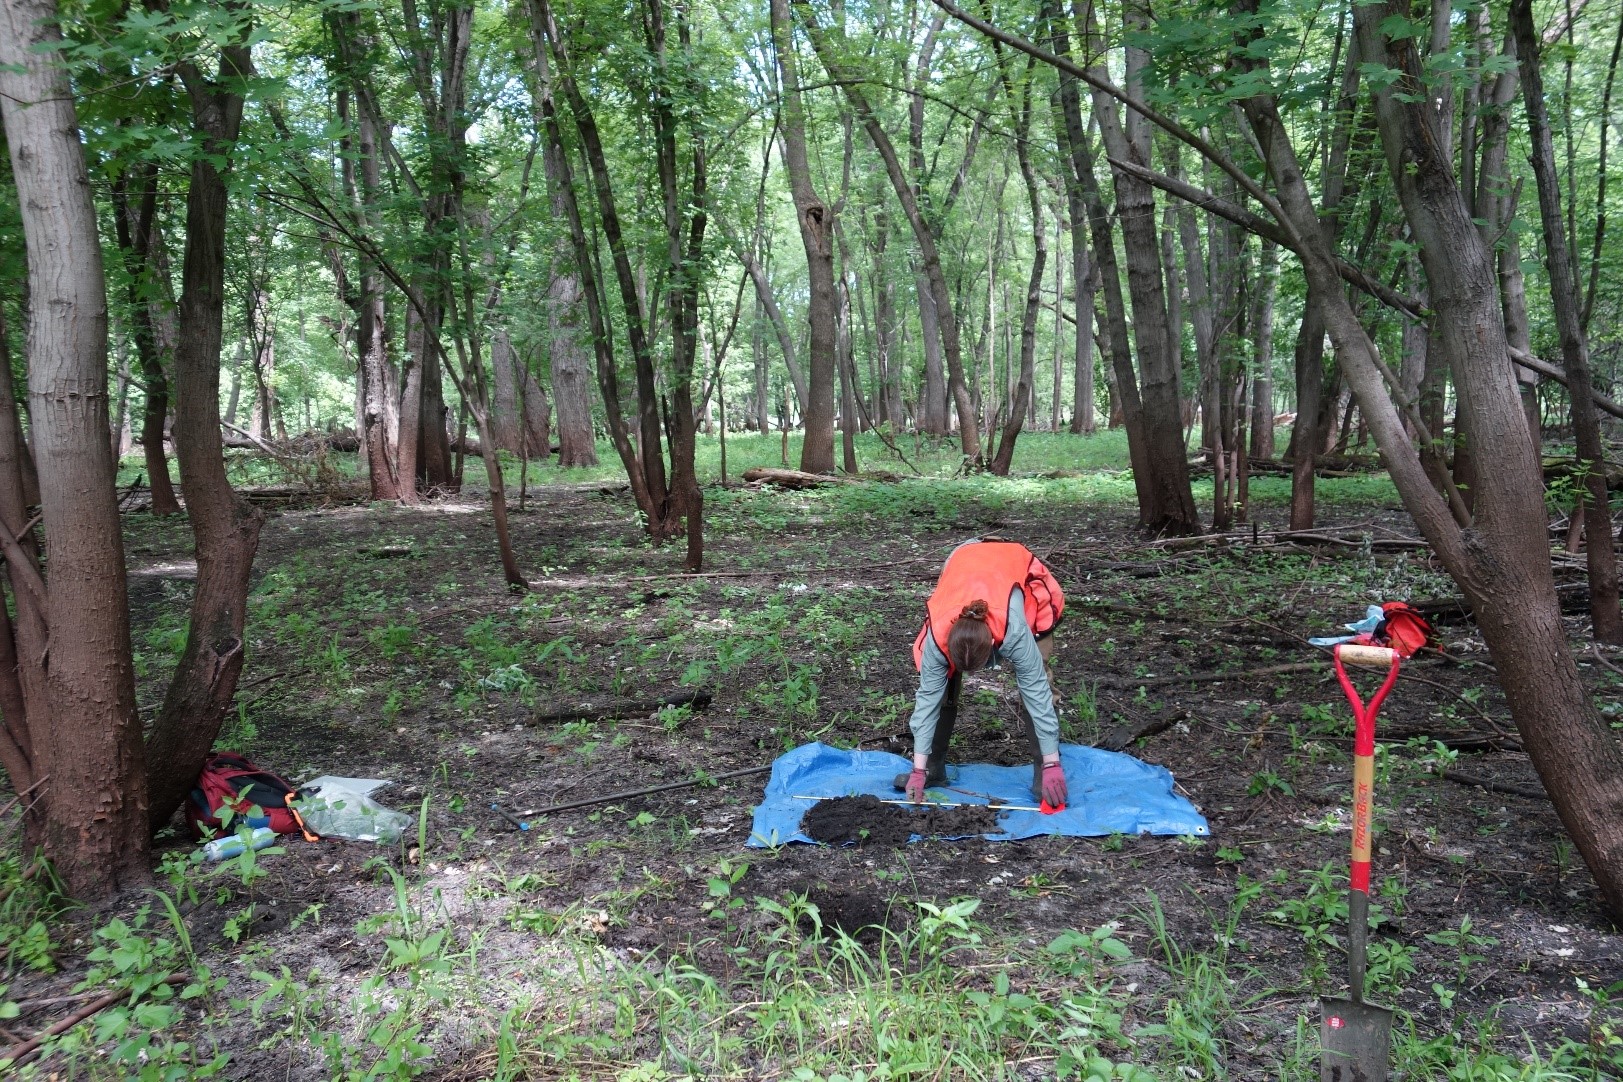
Figure 2022-5: Conditions on Vermillion River boat landing site at sample plot 257 of young forest with excellent silver maple regeneration
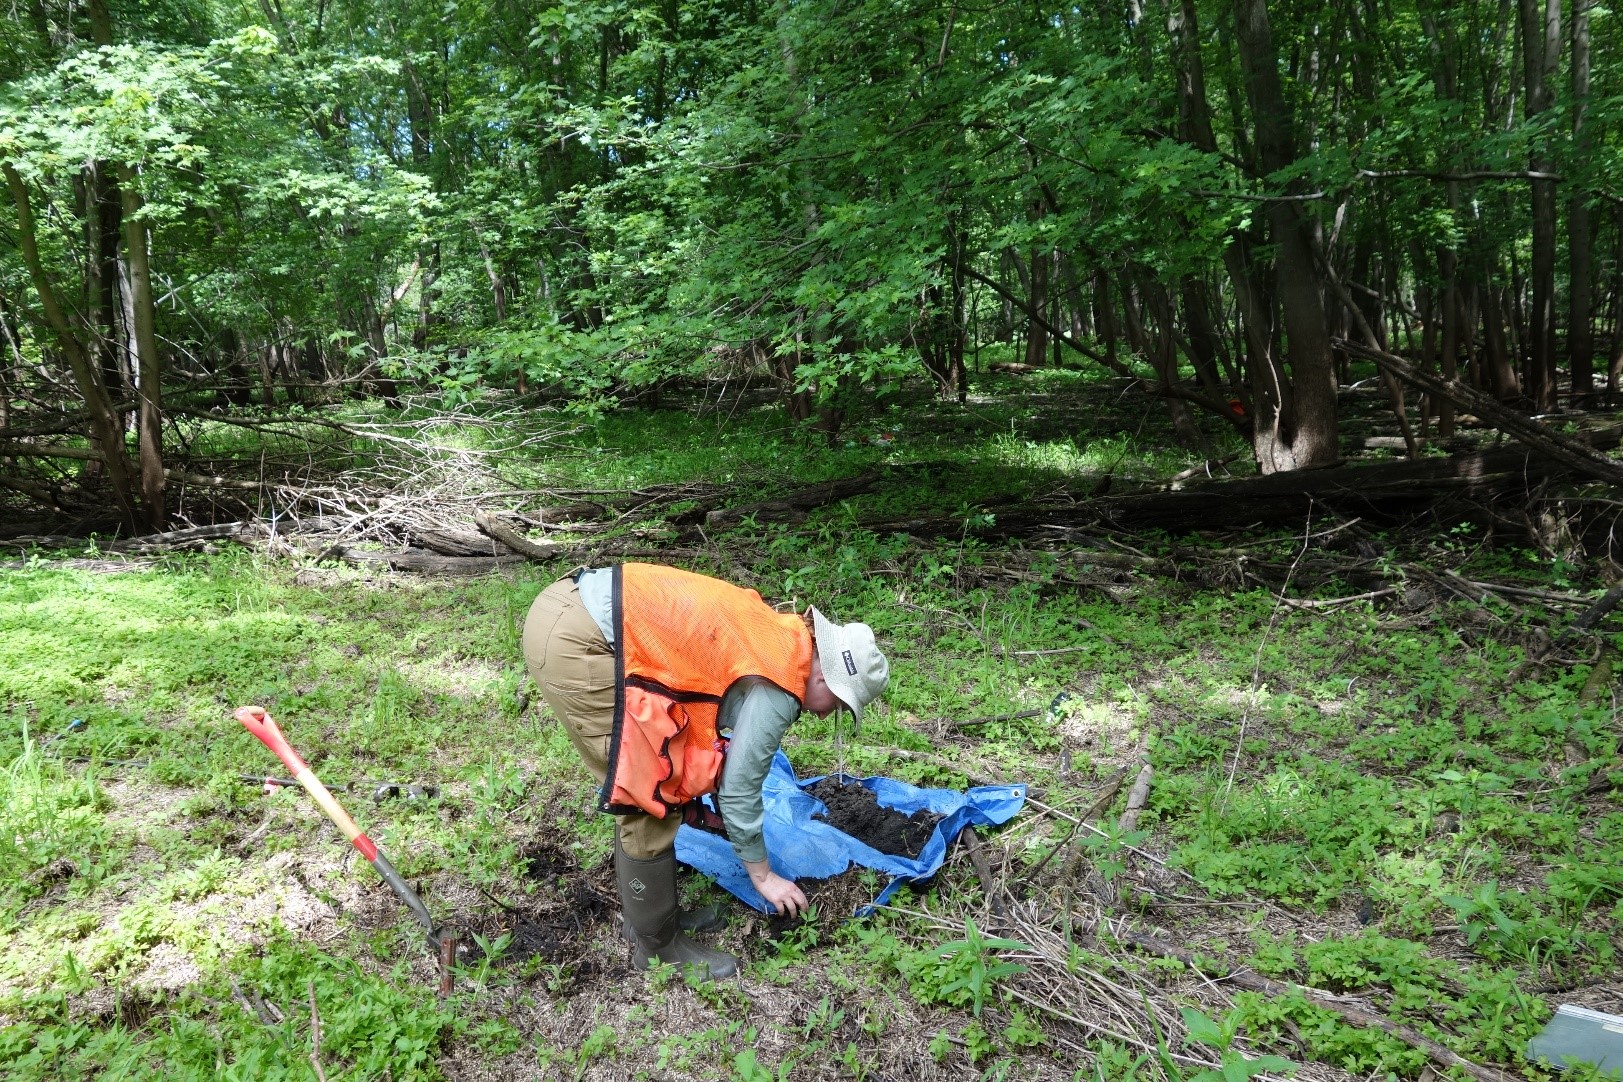
Figure 2022-6: View of non-forested conditions on Vermillion River boat landing site at sample plot 258, looking toward silver maple regeneration patch at plot 257 in the background
Plans for future treatments
The stand will be further evaluated for treatment needs in the next few years when it comes up on the list of stands to be examined during the planning process.
Costs and economic considerations
Costs
Timber sale setup and administration: $ 70/ac (1990/91 dollars
Post-sale killing of competing undesirable trees: $ 100/ac. (1991 dollars)
Hand planting of seedlings: $ 150/ac. (estimate -1991 dollars)
Spot spray herbicide release of seedlings: $ 100/ac. (estimate -1993 dollars)
Field trial - planting of large nursery stock on 1 ac.: $ 14/ac. ($438/ac on 1 ac./31 total ac. – 2000 dollars)
TOTAL COSTS: $ 434/ac. (1990-2000 dollars)
Revenue
Timber revenue on 31 acre harvest $ 120/ac. (1991 dollars)
TOTAL REVENUE: $ 120/ac. (1991 dollars)
Other notes
We had review and editing help:
We gratefully acknowledge the valuable review and editing assistance of MNDNR’s:
- Central Region Forest Health Specialist Brian Schwingle
- Silviculture Program Leader Mike Reinikainen
- ECS Program Coordinator Matt Huseby
We had data collection help: Forestry Intern Elizabeth Reeves assisted with data collection for this study.
Climate Adaptation Considerations
Impacts of wetter climate: The wetter climate of the last 35 years has resulted in a more challenging environment for regenerating Mississippi and Vermillion River floodplain forests. These areas have undoubtedly spent more time underwater during the growing season on average than in the decades preceding the 1980s. The year-round precipitation and growing season precipitation average is about 3 inches higher in the last 35 years than in the preceding 35 years This is not only true for Goodhue County, but collectively for all Minnesota’s Mississippi River Counties (Dakota, Goodhue Wabasha, Winona, and Houston) (Minnesota Climate Trends).
Summary / lessons learned / additional thoughts
1. There are mixed results as of 2020, 30 years after the initial harvest treatment:
- The stand improvement thinning harvest on the portion of the stand with younger, healthier trees in 1991 achieved the objectives of increased tree growth, vigor and health, as well as good regeneration in the gaps.
- The clearcut with reserves, large gap harvest with replanting on the portion of the stand with the oldest trees in 1991 had mixed results:
- Portions of this area have regenerated as planned since the harvest. There are established 10 to 30 year old patches of silver maple in places.
- However, there are portions of the stand that have so far failed to regenerate to trees. Historical imagery shows that portions of the stand were treeless pre-harvest, but other area were in a forested condition
We did not solve the mystery of exactly why silver maple regenerated successfully post-harvest on some portions of the site and not on others. However, we do think there are some valuable takeaways from this study:
2. The correlation between silver maple regeneration success and elevation appears to be complex. In general, higher than average elevations were more likely to support successful silver maple regeneration than lower, but we did find some successful regeneration on relatively low elevations
We found that most silver maple regeneration patches are on slightly higher than average ground for the site, however several patches were actually on relatively low areas. So it seems clear that silver maple regeneration success must be affected by other factors in addition to site elevation.
3. Reed canary grass competition was not a major impediment to silver maple regeneration success on this site
Reed canary grass is clearly a major impediment to silver maple regeneration on some other bottomland sites, however, that is not the case on most of this site. We were surprised that reed canary grass averaged only about 1% of total cover, and plot frequency was only 4.9%. For the most part, the levels we observed indicate that in 2020 it was not a major impediment to tree establishment on a large majority of this site.
4. Spotty mortality on silver maple was probably caused by several recent exceptionally wet years
Extremely high precipitation during the growing seasons of 2016 and 2019 in Goodhue County was probably the cause of spotty mortality observed on silver maple. (Minnesota Climate Trends)
5. Patience and persistence are required to regenerate Southern Floodplain Forest sites.
Based on our findings on this and several other case study sites, we offer that patience and persistence are critical for regenerating this and similar sites in the Mississippi River bottomland hardwoods system. We need to plan on frequent regeneration checks and adaptive establishment efforts as needed until trees reach “free to grow” stage.
We think that the biggest challenge by far is in getting young seedlings tall enough to withstand some growing season flooding. We need to continue regeneration efforts long enough so that seedlings eventually have a period with 2 or more consecutive years without major summer flooding. That will give seedlings a chance to survive and grow tall enough to withstand periodic summer wet periods. Unfortunately, we can’t know ahead of time when those consecutive normal or dryer summer years might happen.
Seedling size to withstand summer flooding will vary due to site conditions. However, they will certainly need to be over 2 feet tall, and maybe even in some cases 10 feet plus, before we consider them “free-to-grow”.
6. Development of consistent regeneration methods for lowland hardwood stands in the Mississippi River floodplain is a significant challenge in need of continued attention.
The major question for bottomland hardwoods regeneration in the Mississippi River bottoms still in need of further study: Can we figure out why silver maple regeneration has occurred in some places, but not in many other, seemingly similar places? We will continue to examine impacts of harvest and regeneration methods, soils, elevation and reed canary grass competition in future studies.
2022 Update:
We found minor soil variability, but nothing that we felt could help explain differences in regeneration success on this Southern Floodplain Forest native plant community site
There was some modest variability between our soil samples, but none that we feel would help explain different levels of regeneration success.
Development of consistent regeneration methods for lowland hardwood stands in the Mississippi River floodplain is a significant challenge in need of continued attention
We were unable to solve the mystery of highly variable regeneration and recruitment success in the Southern Floodplain Forest native plant community through more intensive analysis of soils. There are many factors that may contribute to the variability, including timing and duration of flooding, deposition or removal of seed by floodwaters, harvest and regeneration methods, soils, elevation, influence of water table and reed canary grass competition.
We will continue to examine impacts of harvest and regeneration methods, soils, elevation, influence of water table and reed canary grass competition in future studies.
Supplemental content
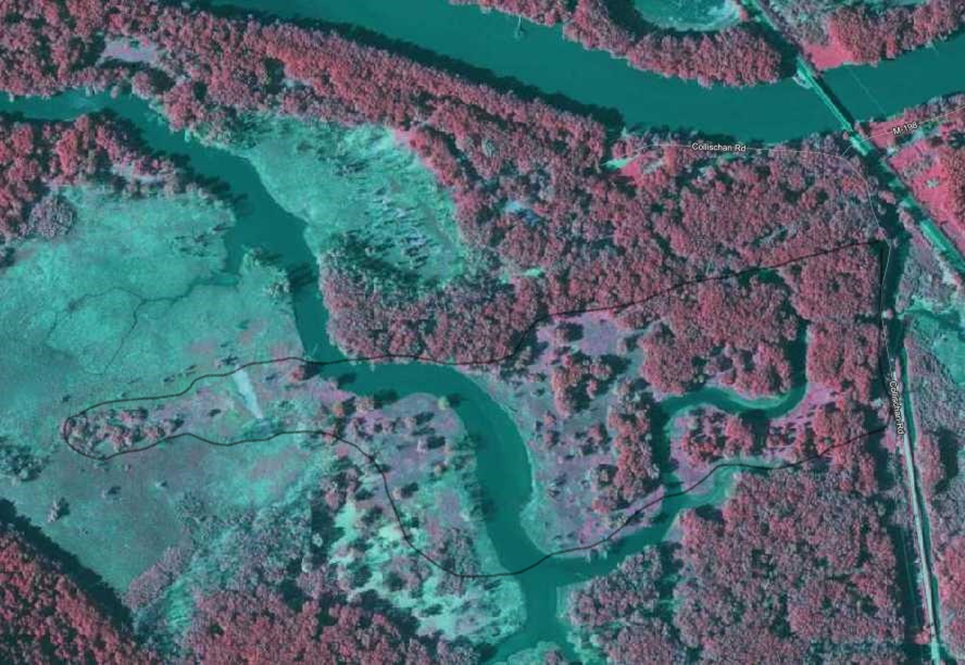
Supplemental Figure 1: 2019 color infrared aerial photo of study site and surrounding area.
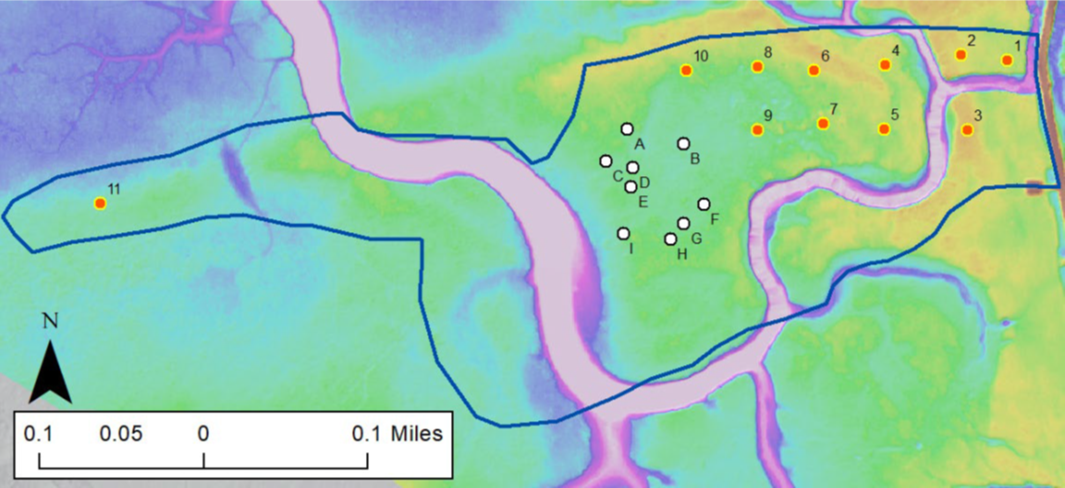
Supplemental Figure 2: 1 Meter digital elevation model (DEM) lidar image of study site
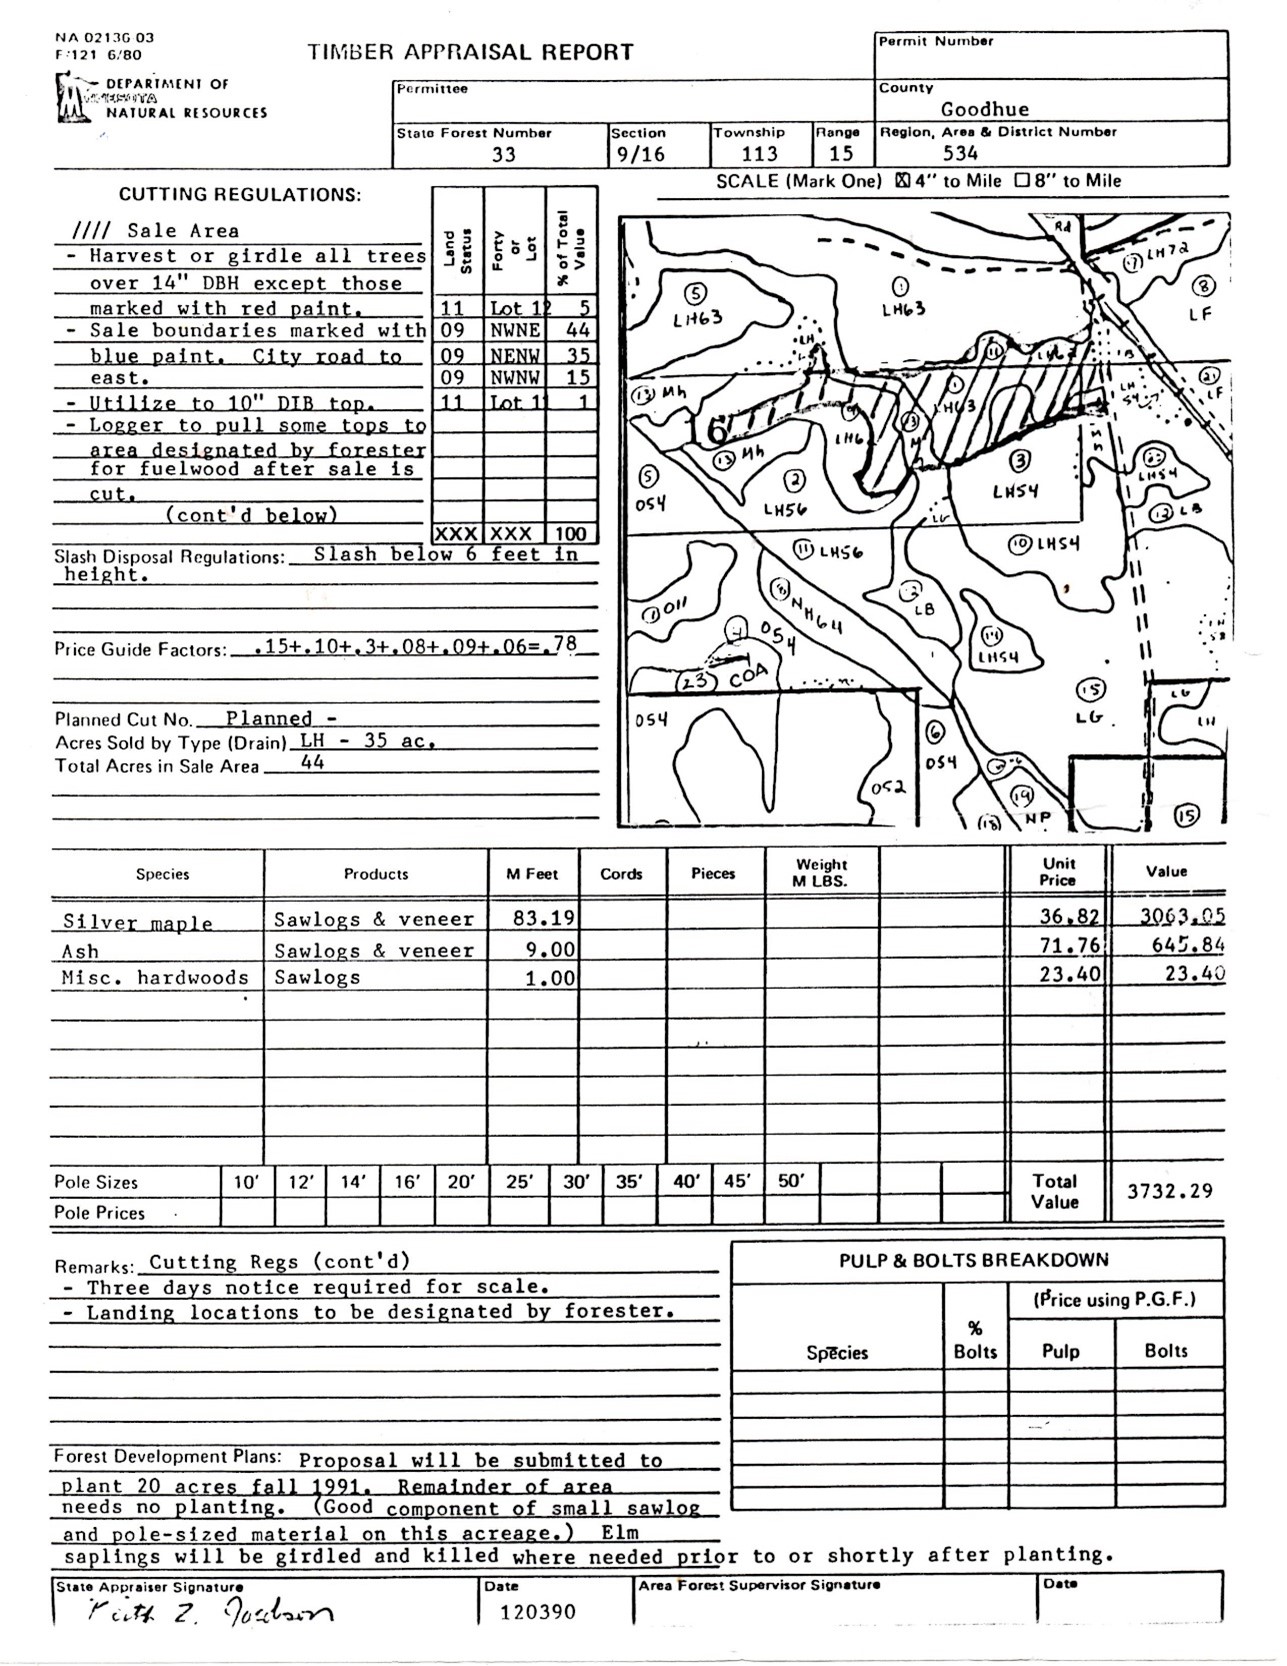
Supplemental Figure 3: 1990 timber sale appraisal.