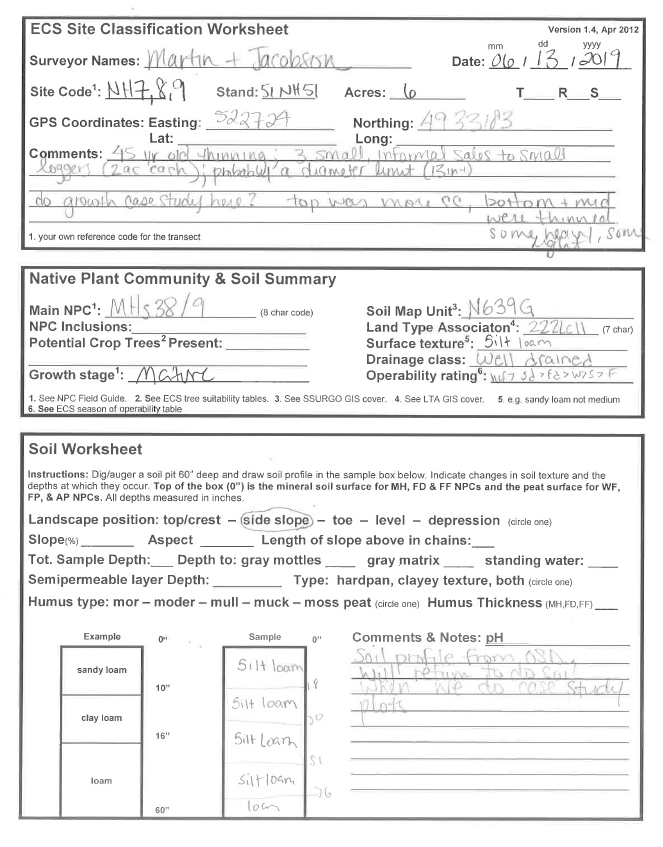
44.551622, -92.713903
Overview
This case study provides an exceptional opportunity to learn about long-term impacts to vegetation of natural and forest management disturbances in a MHs38 Southern Mesic Oak-Basswood Forest native plant community. Some of the impacts are discernable now, and some will need to be assessed by future data gathering and updates. A unique feature of the study is that we are able to assess impacts from one of the earliest recorded (1974) DNR-administered timber harvests on a northern hardwoods forest type in the Richard J. Dorer Memorial Forest.
Data on trees and understory plants is presented in the study.
The disturbance activities on this site have been:
- A 1974 thinning on 6 acres.
- Blowdown of some larger trees on 26 acres during a windstorm in 2008
- A thinning on 26 acres in 2009 that included some blowdown salvage.
The MHs38c native plant community has a state conservation rank of S3.
Condition as of 2020 was a variable density, multi-age northern hardwoods stand, with diverse understory vegetation.
Silviculture Objectives
- 1974 thinning: Release young poletimber to accelerate growth of desired species
- 2009 harvest: Maintain and enhance a diverse, multi-aged northern hardwoods stand while salvaging blowdown timber.
- Maintain the stand’s tree species diversity
- Maintain or enhance wildlife habitat
- Maintain or improve timber value
Pre-treatment stand description and condition
Stand establishment and management history
The State of Minnesota obtained the property in the early 1970s, at which time any pasturing would have ceased, and any timber harvests were under the direction of professional foresters.
The current stand experienced significant blowdown of large trees during a windstorm in 2008, and a thinning and salvage timber harvest in 2009. The westernmost six acres of the stand also had a partial cut timber harvest in 1974.
Pre-treatment species composition
In 1974
Based on information from the 1974 timber sale permit (timber volumes by species, and also the silvicultural objective listed to release the significant amount of poletimber) the overstory in 1974 was dominated by large basswood, with a significant component of red oak. The mid-story was likely to have been well stocked with pole-sized (approximately 6 to 12 inch diameter) red oak, sugar maple and basswood. There were minor amounts of white oak and red elm (and probably a few other species) also present on the site.
Table 1: Species Volumes on 1974 Timber Sale Appraisal - 6 acres
Species | Volume in Thousand Board Feet (MBF) |
Basswood | 39.6 |
Red Oak | 9.3 |
White Oak | 1.4 |
Sugar Maple | .6 |
Red Elm | .3 |
In 2008
From 2007 timber appraisal information and forester recollections, we know that before the 2008 blowdown and subsequent 2009 harvest, the stand overstory on 26 acres was dominated by red oak, sugar maple and basswood. There were small volumes of a number of other species mixed in the overstory, including black ash, bur oak, elm, hackberry and bitternut hickory. There was a good component of sugar maple pole-sized trees in the mid-story, along with smaller numbers of pole-sized basswood, bitternut hickory and hackberry.
Pre-treatment growth and stocking
Table 2: Estimated Species Volumes on 2007 Timber Sale Appraisal
Species | Volume in Thousand Board Feet (MBF) |
Red Oak | 81.3 |
Basswood | 36.0 |
Sugar Maple | 25.7 |
Ash | 2.6 |
Cottonwood | 1.3 |
American Elm | .6 |
Bur Oak | .7 |
Hackberry | .6 |
Trembling Aspen | 4 |
Bitternut Hickory | .2 |
Pre-treatment forest health issues
None noted.
Landowner objectives/situation
While specific objectives vary from parcel to parcel, lands under the administration of DNR-Forestry are managed in alignment with Section Forest Resource Management Plans (SFRMP) to ensure that state forest management activities meet statewide goals for ecological protection, wildlife habitat, timber production, and cultural/recreational values. The DNR assembles teams from the Divisions of Forestry, Fish & Wildlife, and Ecological & Water Resources who work with partners and the public to develop SFRMPs.
Silviculture prescription
The following series of treatments were implemented:
Treatment | Date | Description | Acres Treated |
Harvest | 1974 | Partial thinning of sawlog-sized trees to release pole-sized stems of red oak, sugar maple and basswood. | 6 |
Tree Planting | 1999 (estimated) | Some black walnut was planted on the upper portion of the slope. No planting record was found, so we are not sure of the exact date of planting. The walnut saplings/small trees appeared to be around 20 years old in 2019. | 5 (estimated) |
Underplanting? | 2007? | Oak underplanting is mentioned in a note on the original timber sale appraisal. No other records of any oak underplanting were found, so we are unsure if it was done. | ? |
Windstorm | 2008 | A windstorm blew down some large sawlog-sized trees. The blowdown pattern was patchy. | 26 |
Harvest | 2009 | A partial thinning had been planned and set up in 2007, prior to the windstorm blowdown event. After the windstorm, the stand was reappraised to add the blowdown timber to the sale, and adjust prices in recognition of the decreased value of damaged and blown down timber, and shorten the timeline for its removal without degrading its value further due to stain and rot. | 26 |
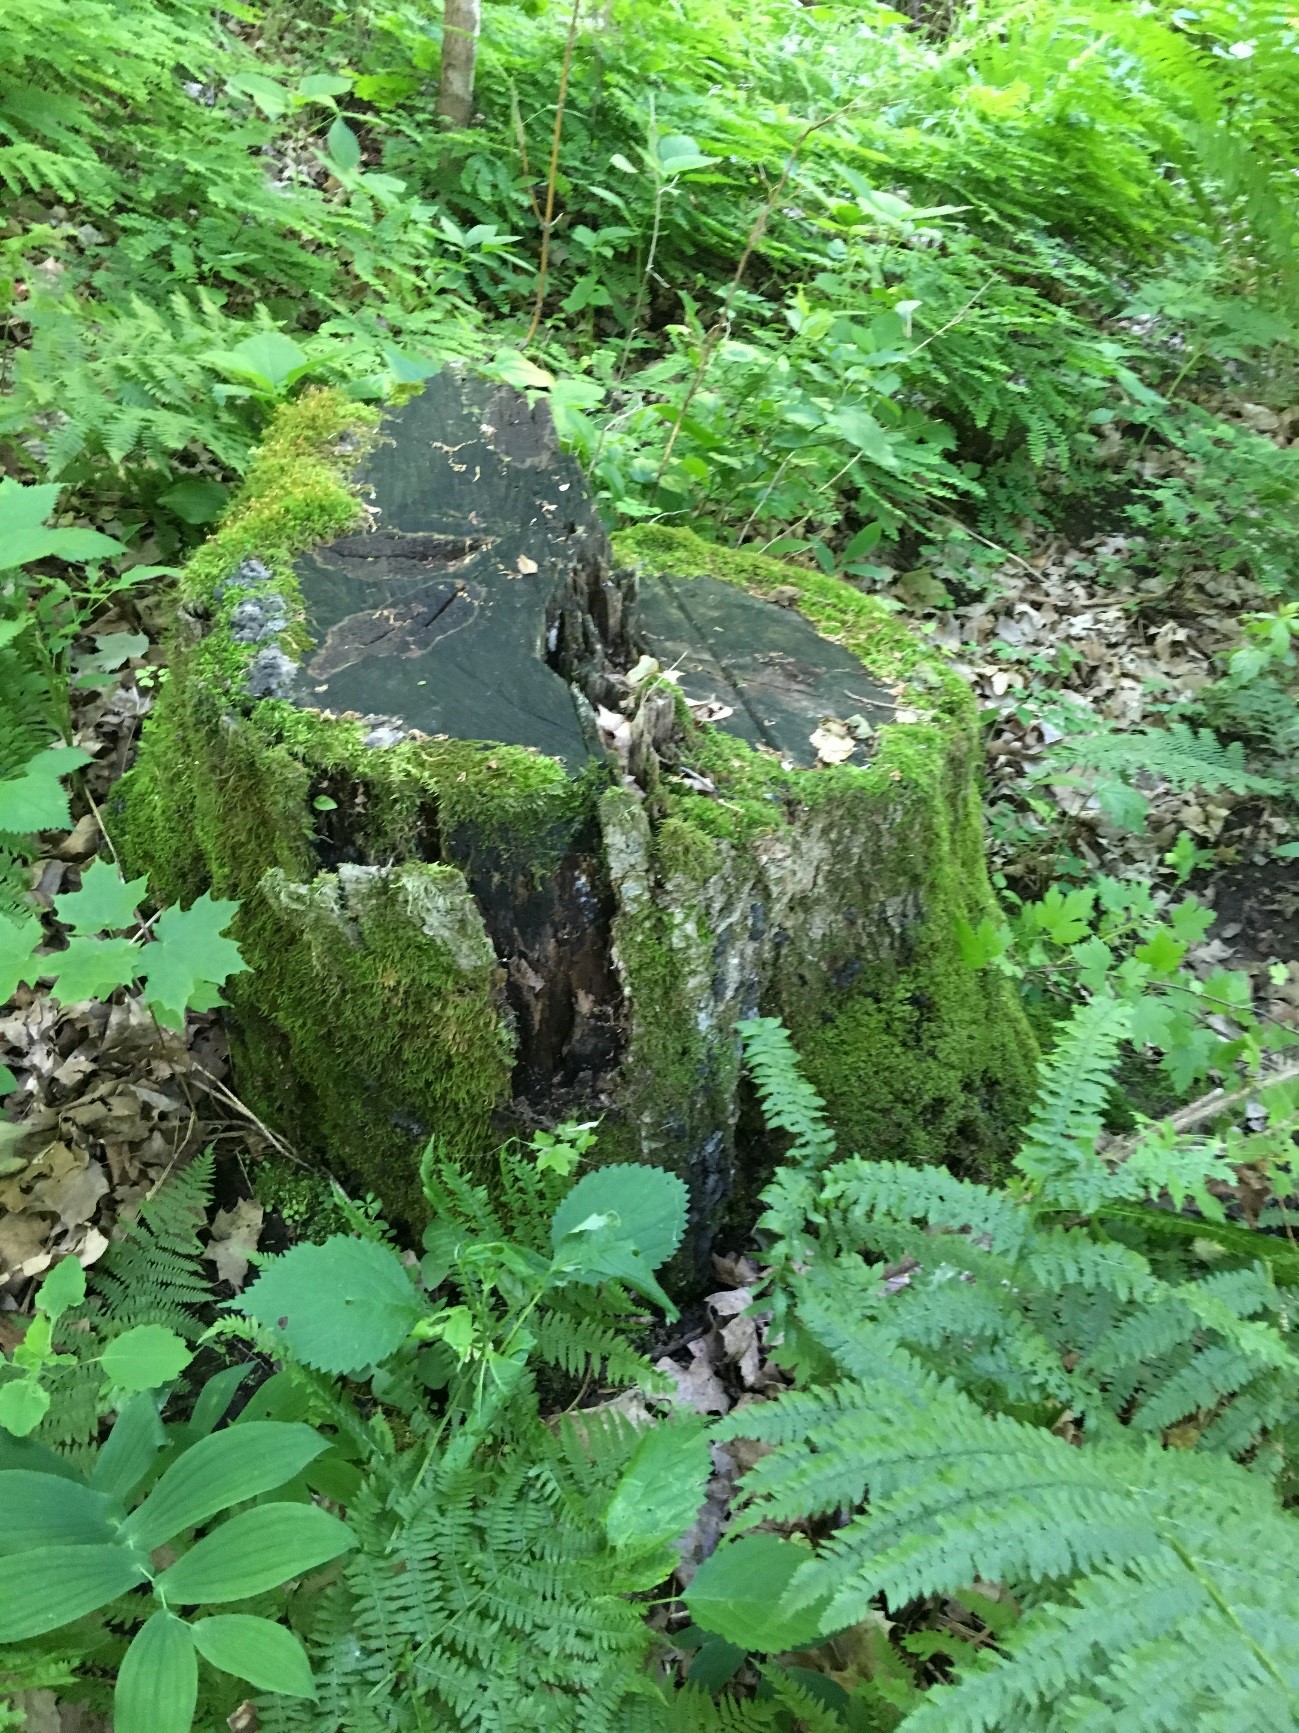
Figure 1: Stump from 2009 blowdown salvage harvest
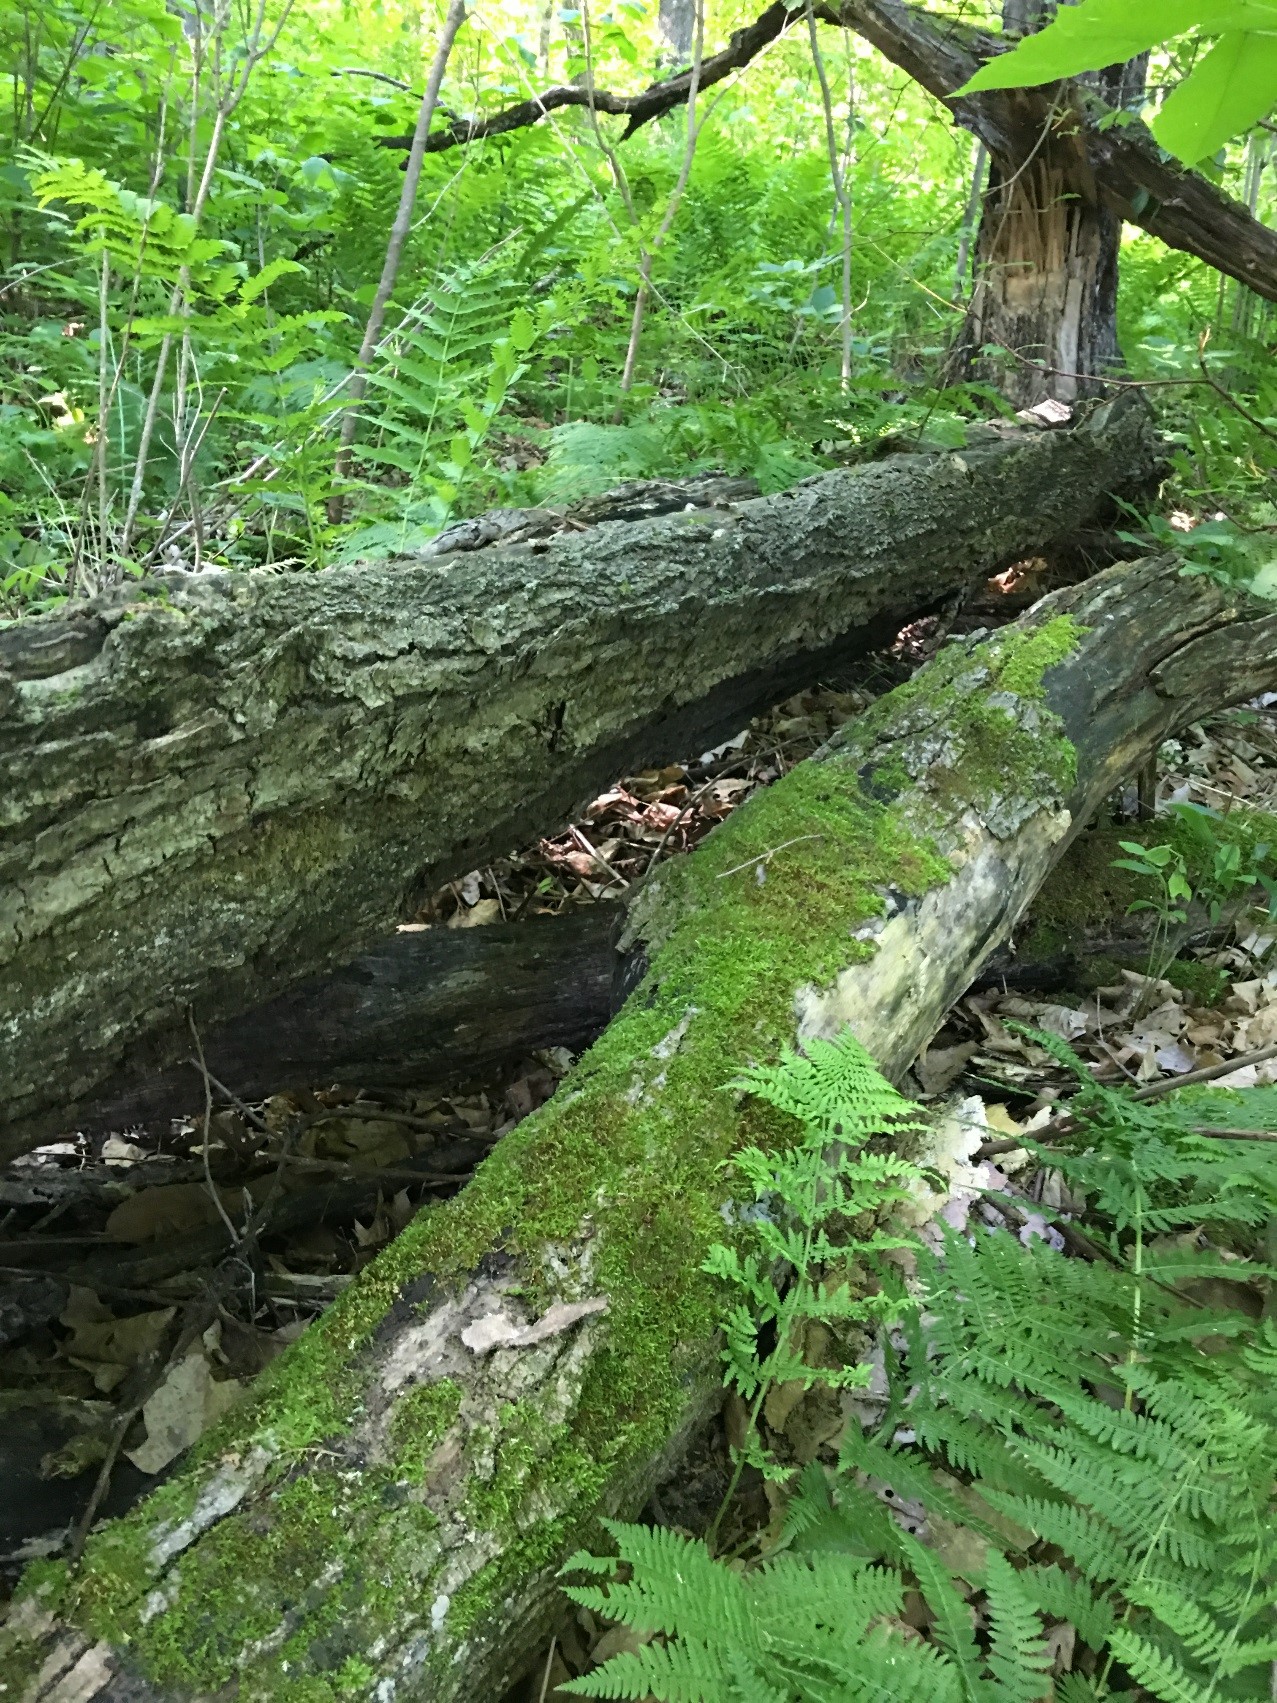
Figure 2: Stem of a red oak tree that was blown down in the 2008 windstorm. Some blown down stems were not salvaged during the 2009 harvest
What actually happened during the treatment
Pretty much what is listed above, including the adjustments to the planned timber sale after the blowdown event.
Post-treatment assessment
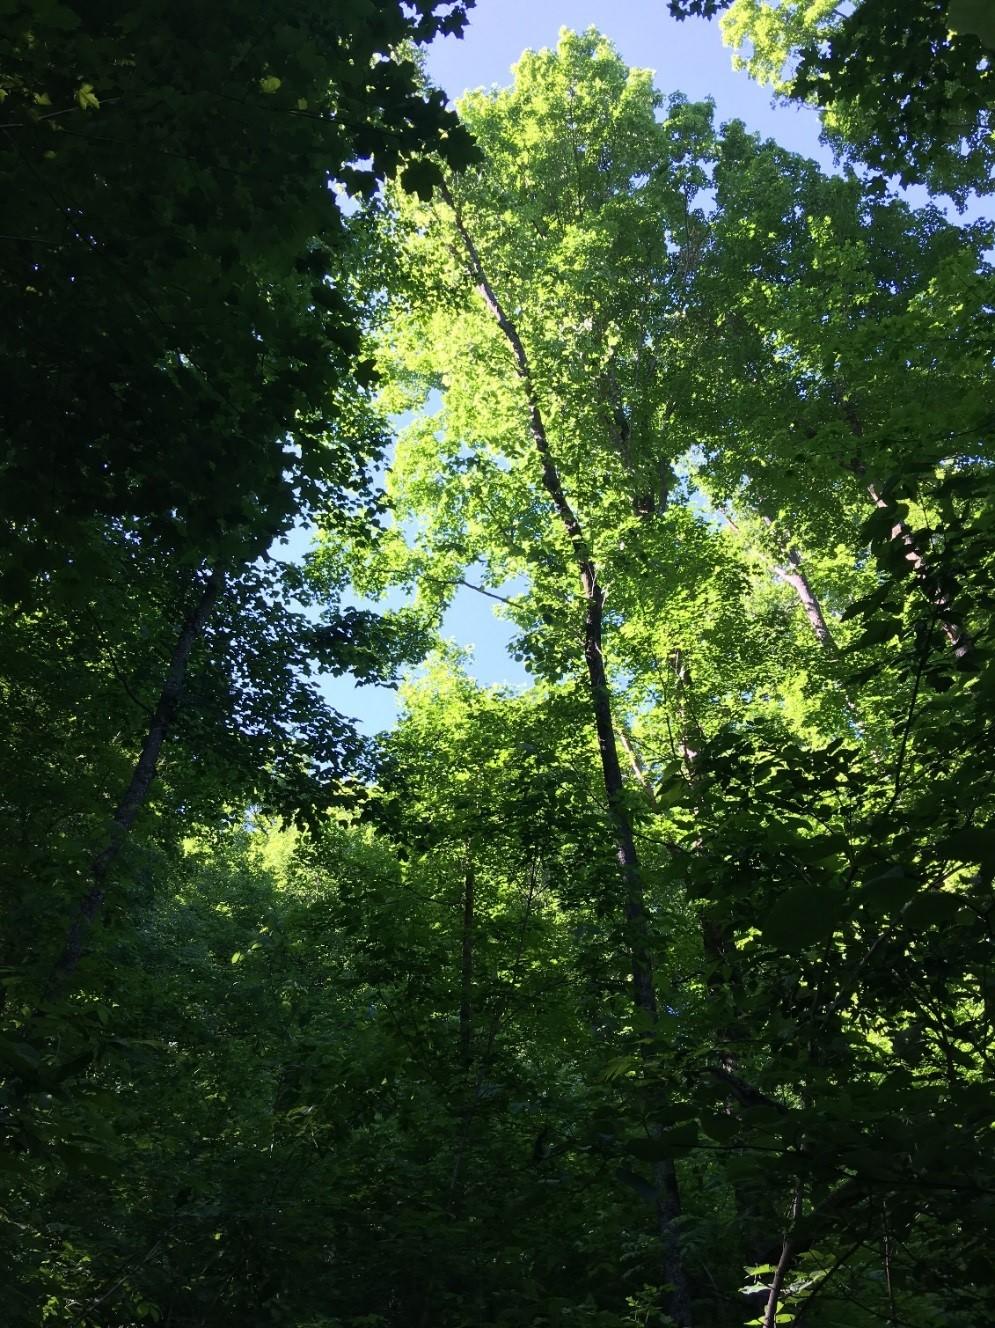
As of 2020, the stand is a multi-aged northern hardwoods forest type with variable size overstory gaps
Overstory and mid-story
The overstory of the current stand is dominated by sugar maple from 15 to 25 inches DBH, along with lesser amounts of basswood and red oak, with small numbers of a few other hardwood species. The mid-story is dominated by sugar maple in the 10 to 14 inch DBH range, with far smaller numbers of several other species mixed in, including basswood, hackberry, ironwood and black ash. The understory contains a mix of many hardwood species in the seedling and sapling stages, dominated by sugar maple.
Overstory gaps vary in size from one tree up to a quarter acre or so. Shadiness at ground level is variable, with portions of some gaps receiving only partial mid-story shade. Portions of the stand with a full overstory are very shady.
Table 3: Tree species basal area and frequency in 2019 for entire site
Species | BA (ft2) | Frequency |
Sugar maple | 38.71 | 97% |
Basswood | 11.61 | 68% |
Red Oak | 7.10 | 45% |
White Oak | 2.90 | 26% |
Black Ash | 2.90 | 16% |
Bitternut Hickory | 0.97 | 10% |
Ironwood | 0.97 | 10% |
Elm spp | 0.32 | 3% |
Hackberry | 0.65 | 3% |
Total BA: | 66.13 |
|
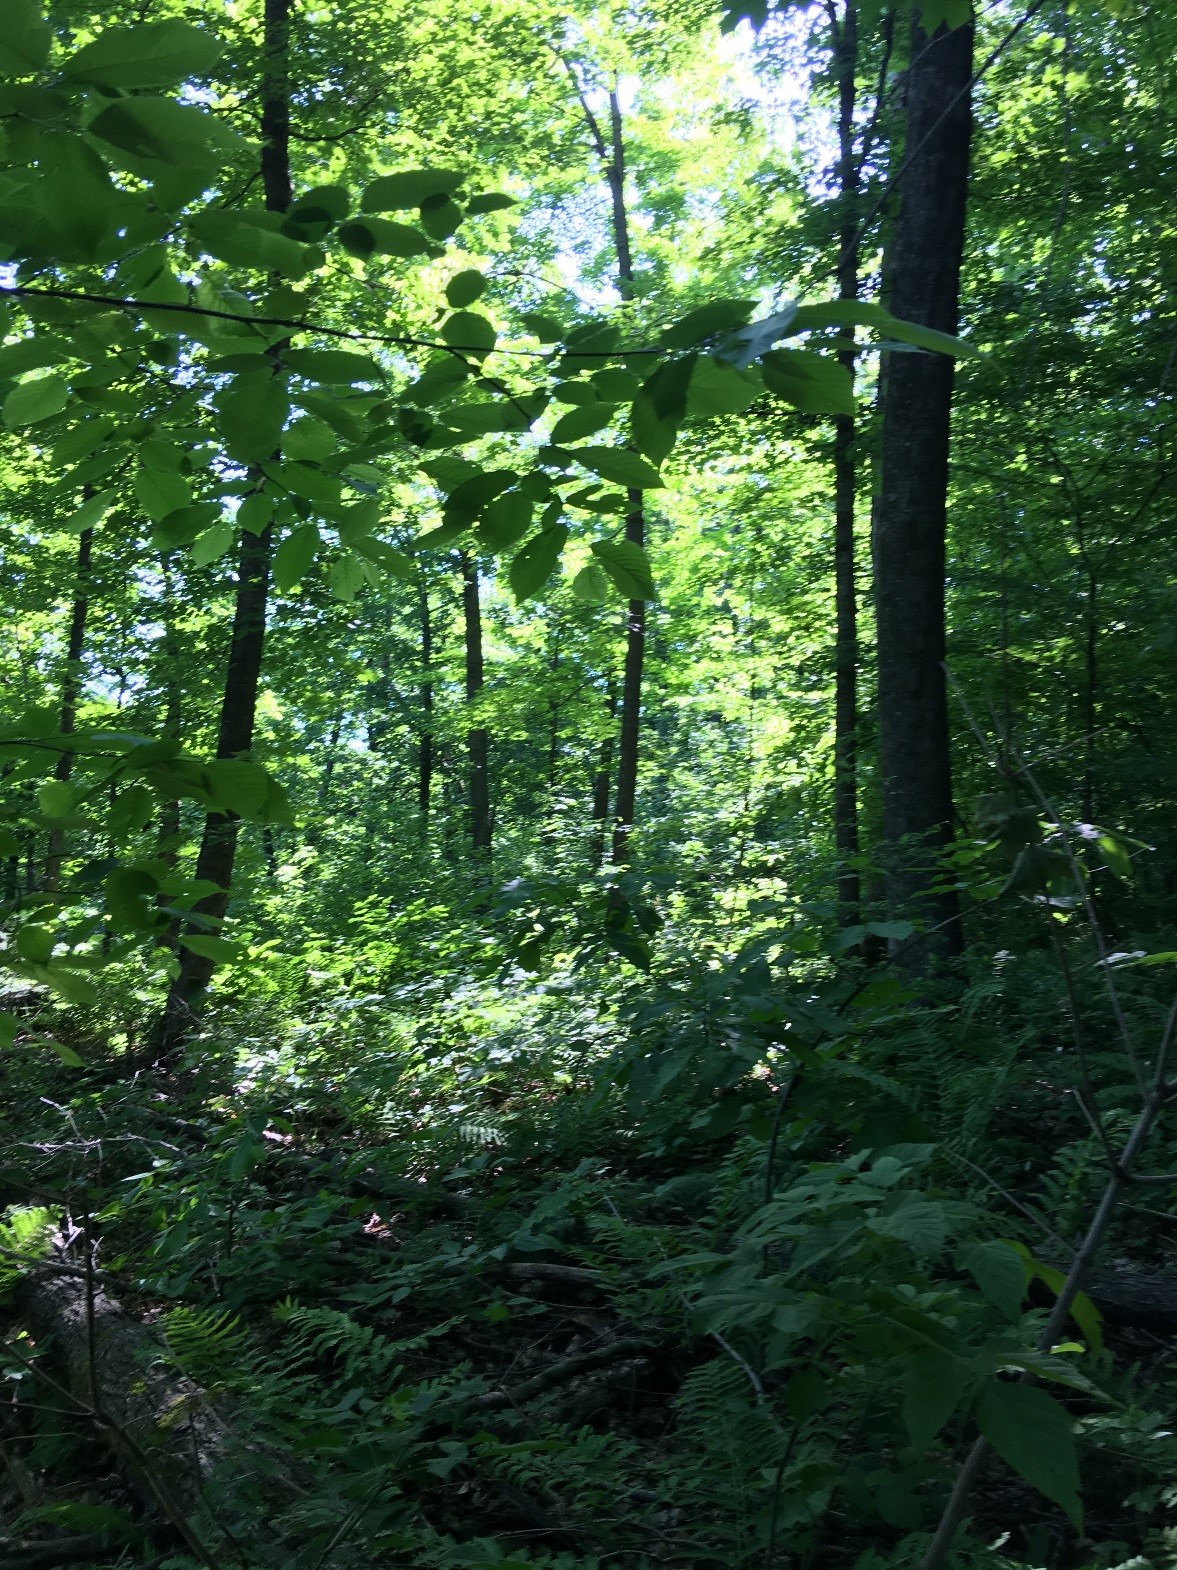
Figure 3: Variable shade in the stand understory caused by variable stand structure and overstory gap size
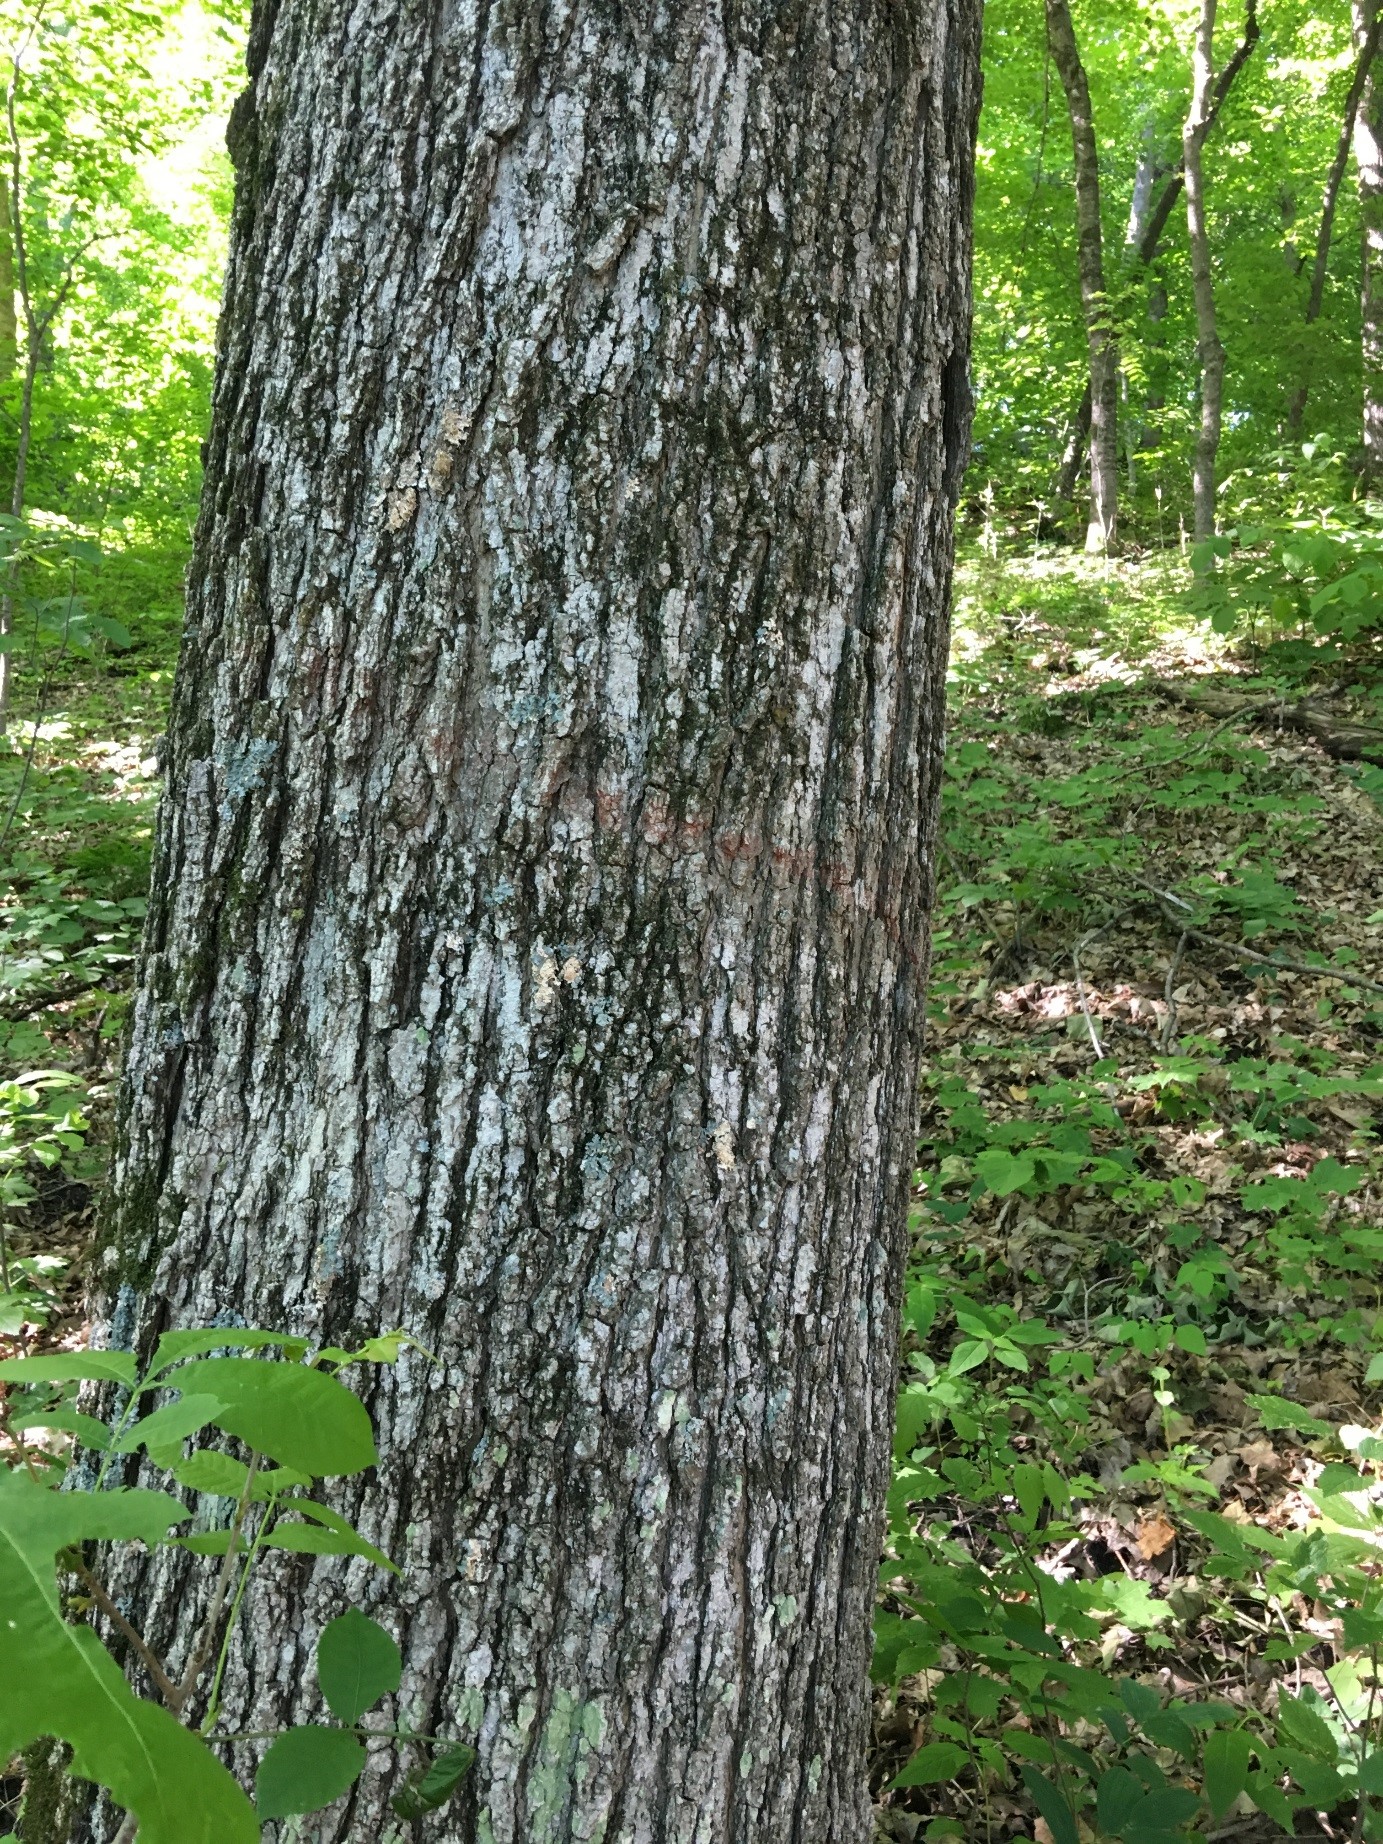
Figure 4: Bough of large sugar maple tree typical on the site. Note the variable stand structure and shade level in the understory in the background
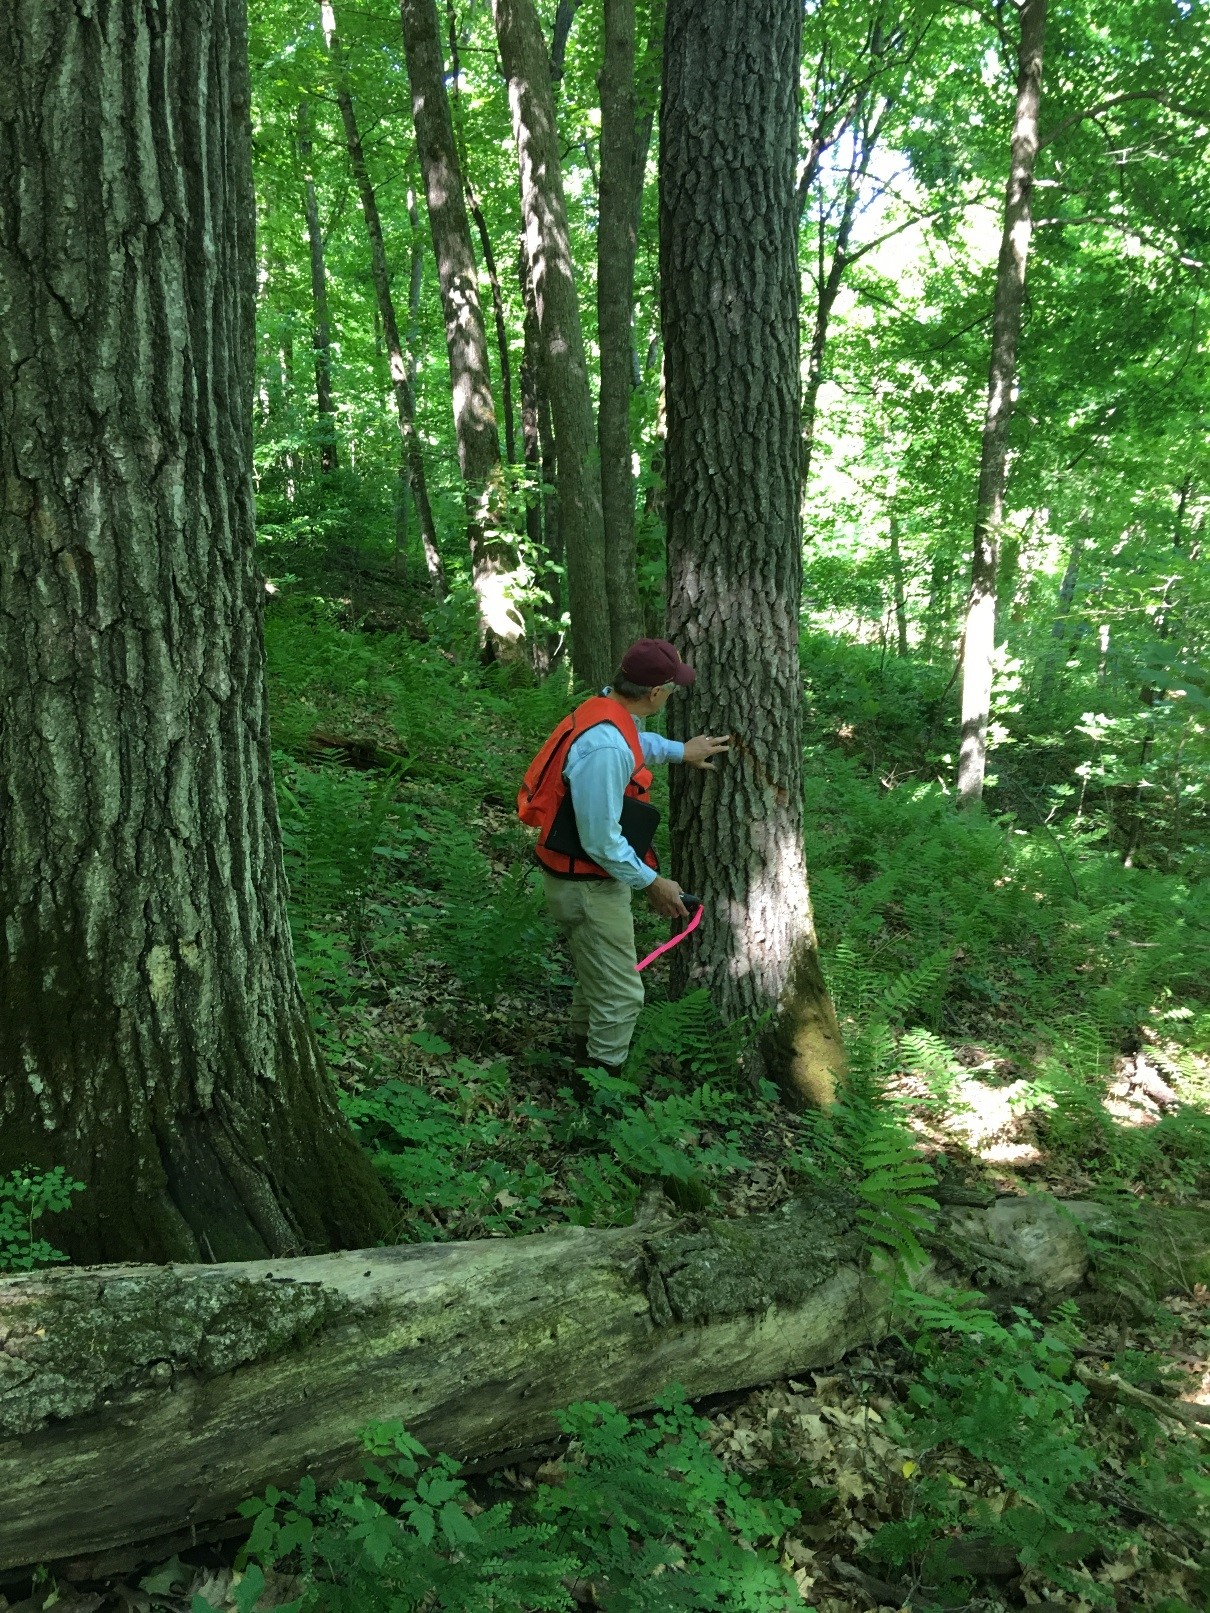
Figure 5: Large, good quality red oak stems in the foreground, sugar maple and basswood stems in the background
Table 4: Tree species basal area by size class, relative basal area and treatment area in 2019
1974 and 2009 Harvest; 2008 Blowdown |
| 2009 Harvest; 2008 Blowdown | ||||
Species | BA (ft2) | Relative BA (%) |
| Species | BA (ft2) | Relative BA (%) |
sugar maple (5-10) | 10.91 | 15 |
| sugar maple (5-10) | 9.50 | 15 |
sugar maple (10-15) | 13.64 | 19 |
| sugar maple (10-15) | 19.00 | 30 |
sugar maple (15-20) | 16.36 | 23 |
| sugar maple (15-20) | 7.00 | 11 |
sugar maple (20+) | 2.73 | 4 |
| sugar maple (20+) | 0.50 | 1 |
basswood (5-10) | 0.91 | 1 |
| basswood (5-10) | 1.00 | 2 |
basswood (10-15) | 4.55 | 6 |
| basswood (10-15) | 4.50 | 7 |
basswood (15-20) | 6.36 | 9 |
| basswood (15-20) | 5.50 | 9 |
basswood (20+) | 0.00 | 0 |
| basswood (20+) | 0.50 | 1 |
black ash (5-10) | 2.73 | 4 |
| black ash (5-10) | 0.50 | 1 |
black ash (10-15) | 0.91 | 1 |
| black ash (10-15) | 0.00 | 0 |
black ash (15-20) | 2.73 | 4 |
| black ash (15-20) | 0.50 | 1 |
red oak (10-15) | 0.91 | 1 |
| red oak (10-15) | 1.50 | 2 |
red oak (15-20) | 0.00 | 0 |
| red oak (15-20) | 5.00 | 8 |
red oak (20+) | 1.82 | 3 |
| red oak (20+) | 3.00 | 5 |
white oak (10-15) | 0.00 | 0 |
| white oak (10-15) | 2.00 | 3 |
white oak (15-20) | 0.91 | 1 |
| white oak (15-20) | 1.00 | 2 |
white oak (20+) | 0.00 | 0 |
| white oak (20+) | 1.00 | 2 |
b. hickory (5-10) | 0.91 | 1 |
| b. hickory (5-10) | 0.00 | 0 |
b. hickory (10-15) | 1.82 | 3 |
| b. hickory (10-15) | 0.00 | 0 |
Elm spp (5-10) | 0.91 | 1 |
| Elm spp (5-10) | 0.00 | 0 |
hackberry (10-15) | 1.82 | 3 |
| hackberry (10-15) | 0.00 | 0 |
ironwood (5-10) | 0.91 | 1 |
| ironwood (5-10) | 1.00 | 2 |
Total | 71.82 | 100 |
| Total | 63.00 | 100 |
NOTE: Overall basal area is a bit higher in the portion of the study area that was thinned in 1974, with relatively modest differences between treatment areas by species.
Table 5: Tree regeneration density for entire site in 2019 (avg. stems/acre)
| Size Class | |||
Species | Regenerant (<1’ height) | Seedling (<1” DBH) | Sapling (1-3” DBH) | Small trees (3-5” DBH) |
sugar maple | 11,097 | 839 | 177 | 29 |
Ironwood | 32 | 194 | 48 | 23 |
black ash | 290 | 129 | 48 | 6 |
bitternut hickory | 129 | 548 | 113 | 0 |
hackberry | 355 | 613 | 16 | 0 |
elm | 65 | 194 | 16 | 0 |
boxelder | 0 | 194 | 16 | 0 |
Red oak | 97 | 65 | 0 | 0 |
basswood | 0 | 32 | 0 | 0 |
black cherry | 0 | 65 | 0 | 0 |
butternut | 0 | 32 | 32 | 0 |
black walnut | 0 | 0 | 48 | 3 |
White oak | 32 | 0 | 0 | 0 |
buckthorn | 0 | 129 | 0 | 0 |
Totals (stems/ac) | 12,097 | 3034 | 514 | 61 |
Table 6. Tree Regeneration Density by Size Class and Treatment Area in 2019 (avg. stems/acre)
1974 and 2009 Harvest and 2008 Blowdown |
| 2009 Harvest and 2008 Blowdown | ||||||||
Species | Regenerant (<1’ height) | Seedling (<1” DBH) | Sapling (1-3” DBH) | Small trees (3-5” DBH) |
| Species | Regenerant (<1’ height) | Seedling (<1” DBH) | Sapling (1-3” DBH) | Small trees (3-5” DBH) |
sugar maple | 6,273 | 273 | 91 | 9 |
| sugar maple | 13,750 | 1,150 | 225 | 40 |
ironwood | 0 | 818 | 0 | 9 |
| ironwood | 50 | 300 | 75 | 30 |
black ash | 727 | 182 | 0 | 9 |
| black ash | 50 | 100 | 75 | 5 |
b. hickory | 182 | 455 | 45 | 0 |
| b. hickory | 100 | 600 | 150 | 0 |
hackberry | 545 | 0 | 0 | 0 |
| hackberry | 250 | 500 | 25 | 0 |
elm | 0 | 273 | 0 | 0 |
| elm | 100 | 150 | 25 | 0 |
boxelder | 0 | 273 | 0 | 0 |
| boxelder | 0 | 150 | 25 | 0 |
red oak | 0 | 0 | 0 | 0 |
| red oak | 150 | 100 | 0 | 0 |
basswood | 0 | 0 | 0 | 0 |
| basswood | 0 | 50 | 0 | 0 |
black cherry | 0 | 0 | 0 | 0 |
| black cherry | 0 | 100 | 0 | 0 |
butternut | 0 | 0 | 0 | 0 |
| butternut | 0 | 50 | 50 | 0 |
black walnut | 0 | 0 | 91 | 0 |
| black walnut | 0 | 0 | 25 | 5 |
white oak | 0 | 0 | 0 | 0 |
| white oak | 50 | 0 | 0 | 0 |
buckthorn | 0 | 273 | 0 | 0 |
| buckthorn | 0 | 50 | 0 | 0 |
Totals | 7,727 | 2,547 | 227 | 27 |
| Totals | 14,500 | 3,300 | 675 | 80 |
While both treatment areas have more than adequate desirable regeneration present, there are more species present and generally in greater abundance on the portion of the site that had only the 2008 blowdown and 2009 harvest – the portion not thinned in 1974. Some possible reasons include the lower basal area (and presumably more sunlight) on that portion of the site; subtle ecological differences in the site itself; impact of the 1974 thin; or a combination of factors.
Understory Plant Information
We are not currently able to do so, but we plan to publish an update to this study with details of understory plant information within the next year.
One of the things we want to learn more about is understory response to timber harvest over time in some plant communities such as MHs38. There are sure to be impacts for a period after disturbance events such as these partial harvests, and patchy blowdown. Shade conditions over time have clearly been variable across the site and over time, including portions where significant shade has been retained. Two questions we wanted to at least begin to examine were:
1) Are there portions of the stand with high shade retention where the understory plants were unaffected, or nearly so?
2) In portions of the stand with overstory gaps and greater sunlight after disturbance: Over time as the overstory continues to fill in, will the understory return to more of its pre-disturbance composition and form?
We collected data on June 9th of 2020 on 3 things:
- presence and abundance of ground layer herbaceous plants and shrubs.
- leaf litter % cover.
- residual tree basal area (as a metric to assess shade level at each plot).
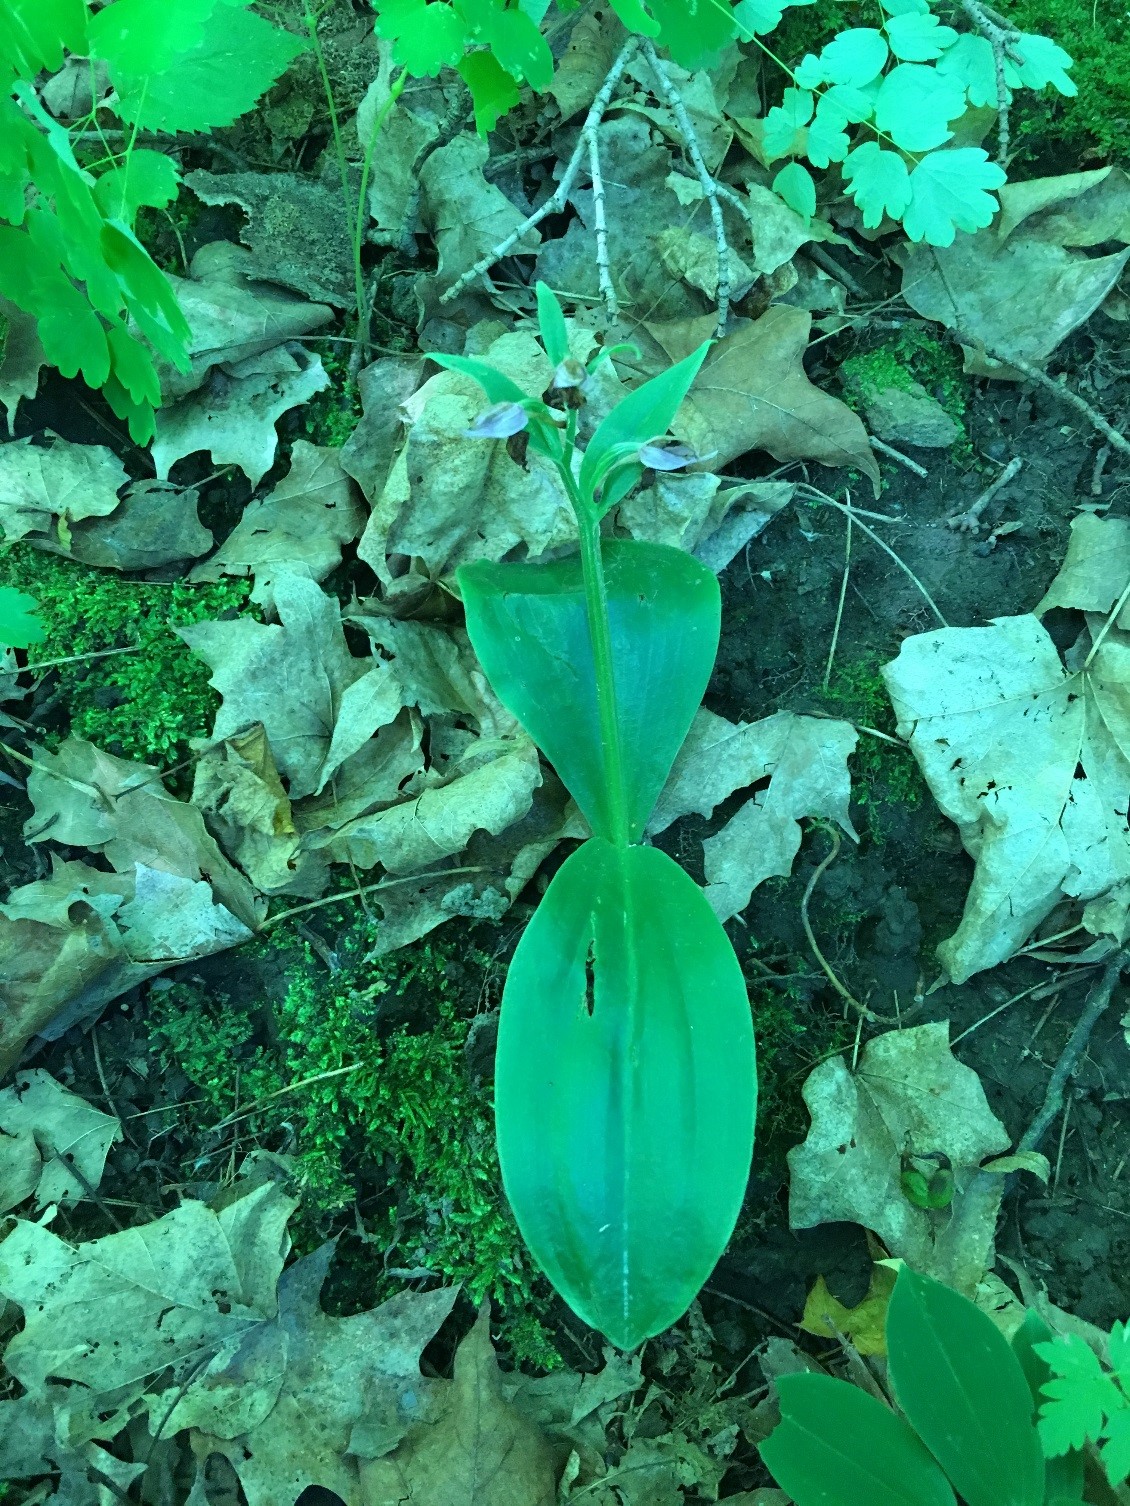
Figure 6: A few showy orchid (Galearis spectabilis) plants were present in the stand during a June visit; they were just nearing the end of their flowering season
To fully assess understory plant response over time, it will be important to perform follow up data gathering in periodic intervals for at least 15 years into the future on this site.
Tree Growth Response to Thinning
Not surprisingly, there were clearly positive annual radial growth responses to the 1974 thinning and the patchy 2007 blowdown/2009 salvage harvest events (Table 7 and Supplemental figure 4).
Annual radial growth increments for trees can be quite variable by year and by individual tree. This is because of variable annual weather conditions, and also because health, vigor and crown exposure to light varies by individual tree. For example, average annual radial growth of individual measured trees ranged from a low of 1.04 millimeters to a high of 2.85 millimeters from 2010 to 2019 one of the measured trees averaged 1.83 millimeters (the 10 years after blowdown and thinning/salvage harvest).
Therefore, we calculated 10 year average annual increments before and after disturbance as a best measure of residual tree growth response to thinning disturbance. The average annual tree ring increment increased by 38% for the 10 year period after thinning, and by 83% for the 10 year period after blowdown and salvage harvest.
Table 7: Average annual radial growth increment for 11 sugar maple trees for 10 year periods before and after harvest
10 year period | Average annual tree ring increment for 11 sugar maple trees (Unit of measure = millimeters) | Notes |
1976-1985 (the 10 years after thinning) | 1.6608 | .4576 millimeters, or a 38% greater annual radial growth increment post-thin. |
1966-1975 (the 10 years before thinning) | 1.2032 | |
2010-2019 (the 10 years after salvage) | 2.0338 | .9234 millimeters, or an 83% greater annual radial growth increment post-blowdown and salvage. |
2000-2009 (the 10 years before salvage) | 1.1104 |
Plans for Future Treatments
Monitor the stand through periodic inventory surveys. Design and execute release and/or regeneration efforts if needed.
Costs and economic considerations
If possible, break down by treatment components: Time estimate to lay out / plan, time to harvest, timber sale revenue, site prep or other costs, etc.
Costs
Staff time for timber sale setup and administration 1974: $60/ac (1974 dollars)
Staff time for timber sale setup and administration 2009: $125/ac (2009 dollars)
TOTAL COSTS $ 185/ac (1974 and 2009 dollars)
Revenue
Timber revenue 1974 $ 204/ac (1974 dollars)
Timber revenue 2009 $ 789/ac (2009 dollars)
TOTAL REVENUE: $ 993/ac (1974 and 2009 dollars)
Other notes
Acknowledgements:
- Former MNDNR Foresters Larry Westerberg and Josh Wall set up and administered several of the silvicultural practices that were the focus of this study.
- MNDNR Forestry Interns Amelia Knoll and Alex Love gathered and helped to analyze data for this site.
- The University of Minnesota measured tree annual radial growth increments.
- MNDNR Silviculture Program Consultant Mike Reinikainen provided review and editing assistance.
This case study was developed with support from the United States Department of Agriculture's National Institute for Food and Agriculture, Renewable Resources Extension Act. Project #2021-46401-35956, principal investigator Eli Sagor, University of Minnesota.
Summary
As of 2020, 45 years after an initial thinning on part of the site and 12 years after a patchy blowdown and thinning harvest event in 2008, the stand is a multi-aged northern hardwoods forest type with variable size overstory gaps.
There were positive annual radial growth responses to the 1974 thinning and the patchy 2007 blowdown/2009 salvage harvest events. See Supplemental Table 1 attached below.
This site provides an excellent opportunity to continue to learn more about understory response to timber harvest and blowdown disturbances over time in the MHs38 plant community. We are not currently able to provide analysis of ground layer herbaceous vegetation, but we plan to do so via an update to this study within the next year.
Two questions we plan to examine are:
1) Are there portions of the stand with high shade retention where the understory plants were unaffected, or nearly so?
2) In portions of the stand with overstory gaps and greater sunlight after disturbance: Over time as the overstory continues to fill in, will the understory return to more of its pre-disturbance composition and form?
Supplemental content
Supplemental table 1: Annual tree ring increments for 11 sugar maple trees cored fall 2019.
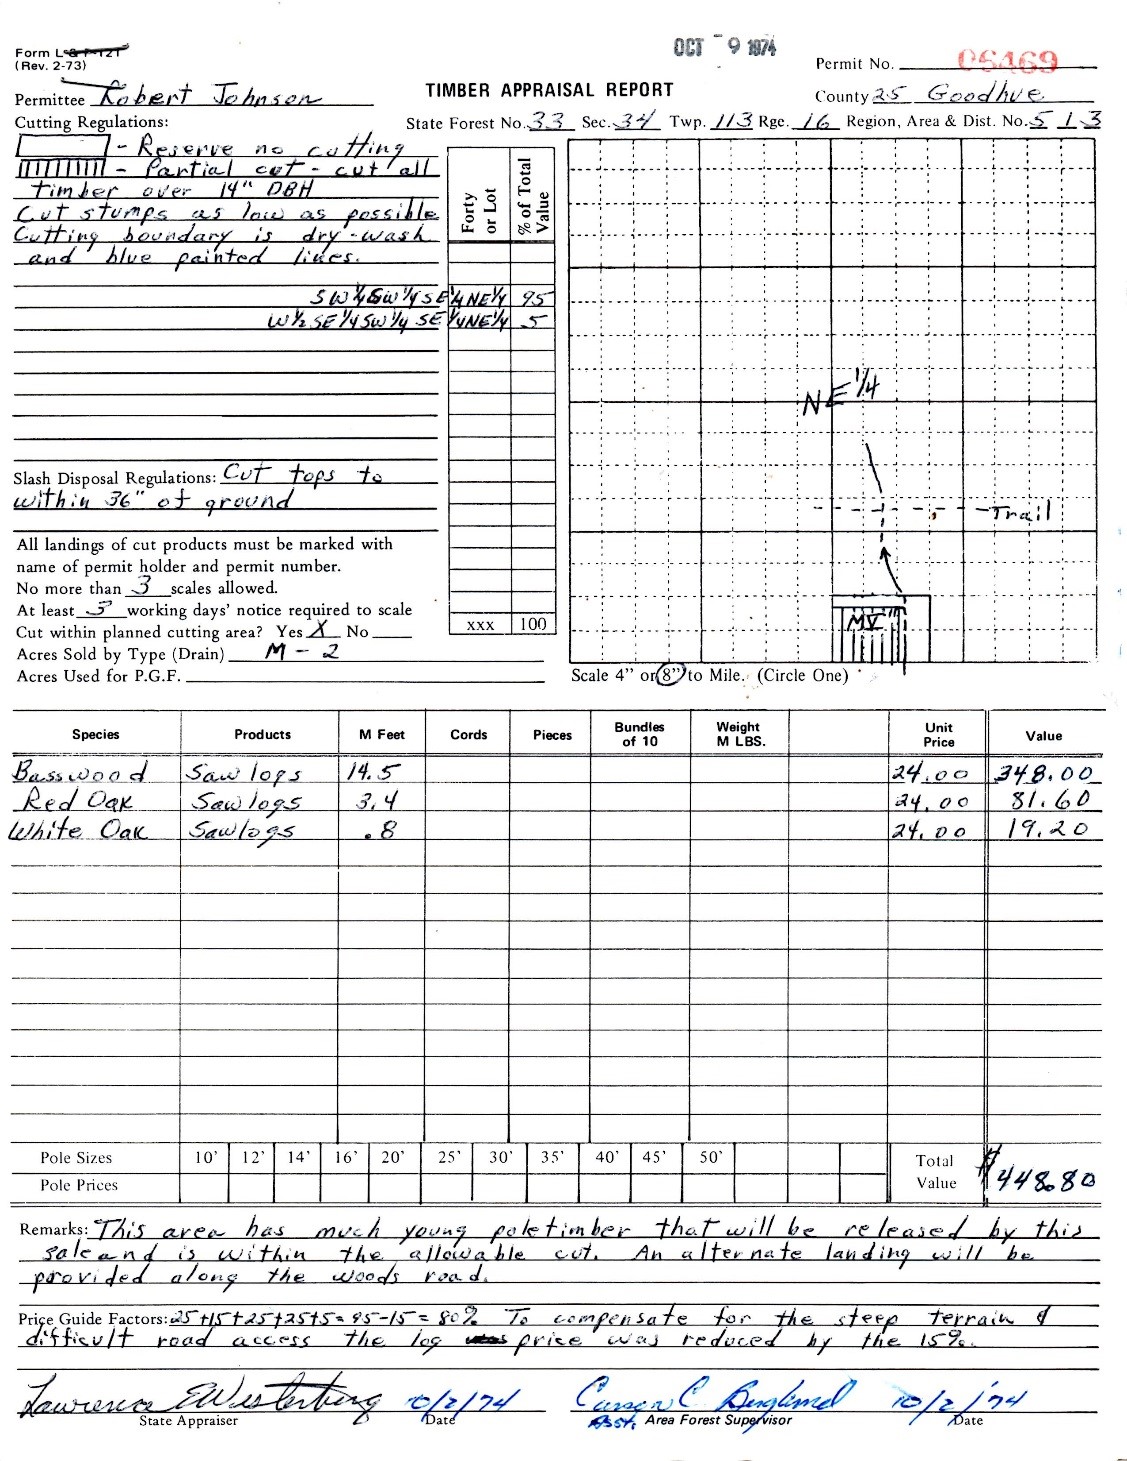
Supplemental figure 1: 1974 timber sale permit. This permit is for one of 3 adjacent 2 acre sales, for a 6 acre total. The sale regulations and remarks were the same for each of the 1974 sales.
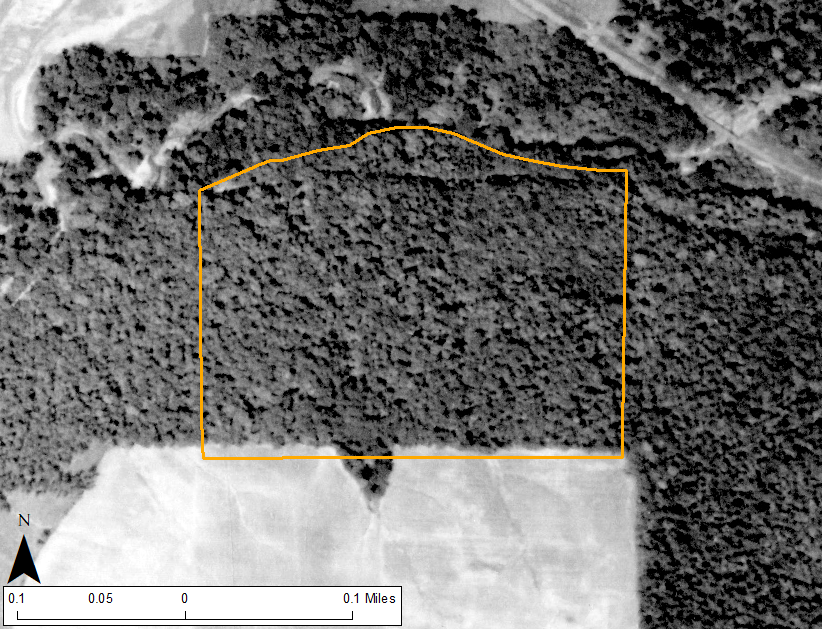
Supplemental figure 2: Site boundary outlined in orange over 1938 air photo
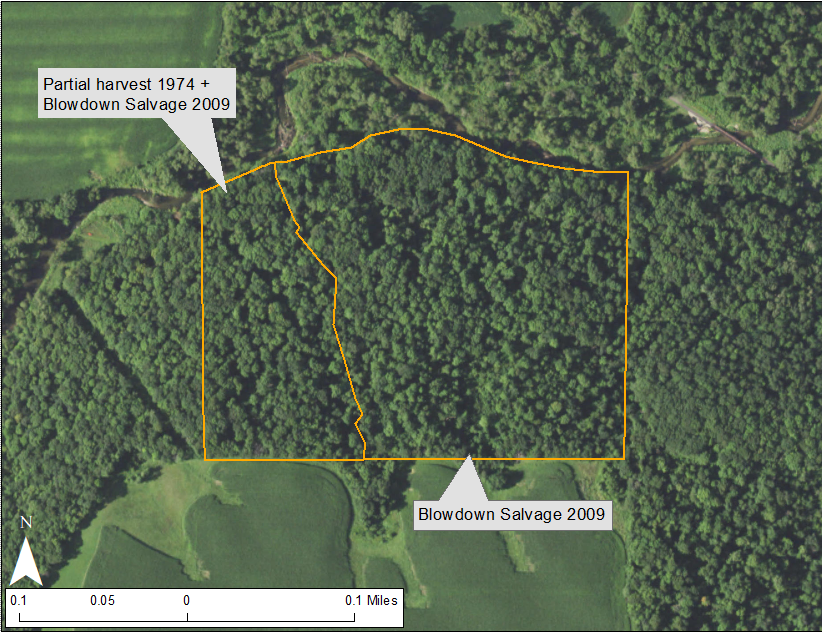
Supplemental figure 3: Site boundary outlined in orange over 2019 FSA Color air photo. The western most portion of this site had a partial harvest in 1974 and a blowdown salvage harvest in 2009. The eastern 2/3rds of the site had only a thinning and blowdown salvage harvest in 2009. The entire site experienced a patchy blowdown event in 2008.
Supplemental figure 4: Page 1 - native plant community worksheet
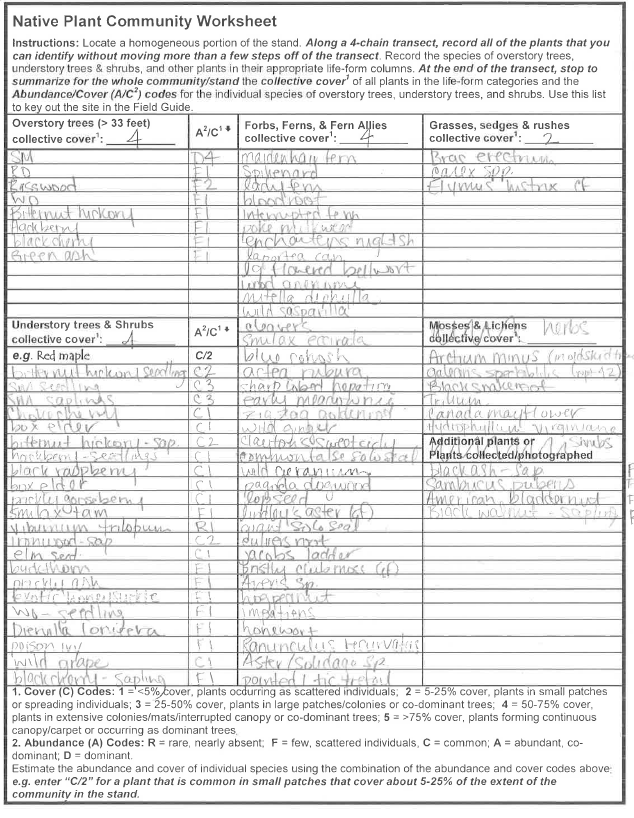
Supplemental figure 5: Page 2 - native plant community worksheet with plant list