46.2859, -93.127761
Overview
The purpose of this study is to evaluate the effect of commercial hardwood thinning on residual tree and forest stand growth to help make decisions on future forest management.
In the Aitkin and Sandstone DNR-Forestry administrative areas, a considerable amount of thinning in hardwood stands has been done since the early 1990s. 4 of the major factors driving this work were:
- Large acreage of hardwood forest types reaching age and condition to make them good candidates for thinning (See Figure 3).
- Increasing dependence on timber from hardwood forest types to meet overall sustainable timber harvest volume goals.
- Existence of improved markets for hardwood timber in the area.
- Professional interest of staff and adequate staffing levels.
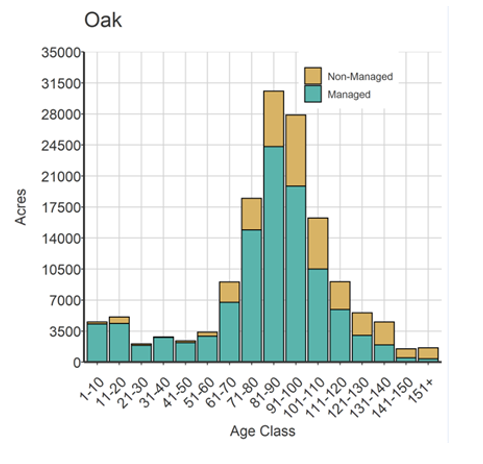
Figure 3: Oak forest type acres by age class and management status on MNDNR administered forest lands as of 2022
Modeling during the forest planning process identified many of these previously thinned hardwood stands as having recovered high enough basal area to be ready for another thinning harvest. However, during subsequent field examinations, most of these stands have shown inadequate basal area for another thinning. In other words, radial growth of hardwood trees has been less than predicted under existing models used for forest planning. Many of these stands also are just reaching the age where we would consider regeneration harvests on them.
Therefore, we clearly need better data and analysis to improve our understanding of thinning impacts on tree and stand growth to inform future forest management decisions.
Case Study Objectives
- Assess post-thinning radial growth to better inform type, timing and design of future forest management practices. We need to optimize hardwood thinning re-entry periods and also timing of regeneration harvests.
- Assess impacts of species, stand age, past management, native plant community (NPC) on radial growth. Again, this information would be useful in designing future forest management practices.
- Gather post-thinning stand ingrowth information for use in updating hardwood growth models to better inform forest planning efforts.
Study design
To evaluate growth response to treatment, pre-thinning and post-thinning basal area and a documented year of thinning treatment are required. Therefore, study sites were selected based on the quantity and quality of available records of past management activities. Only sites with forest inventory and Intensive Hardwood Inventory (IHI) information at multiple points in time over the past 25 years were included.
Field Data Gathered Summer 2019 and 2020
Intensive Hardwood Inventory data, which consists of:
- Basal area by species and tree quality classes.
- Site index.
- Trees per acre.
Additional data collected for the study:
• Radial growth samples (tree cores)- to show response of individual trees to previous thinning.
• ECS site classification. NOTE: Many sites have NPC class already identified, but we re-assessed to make sure the classification were accurate.
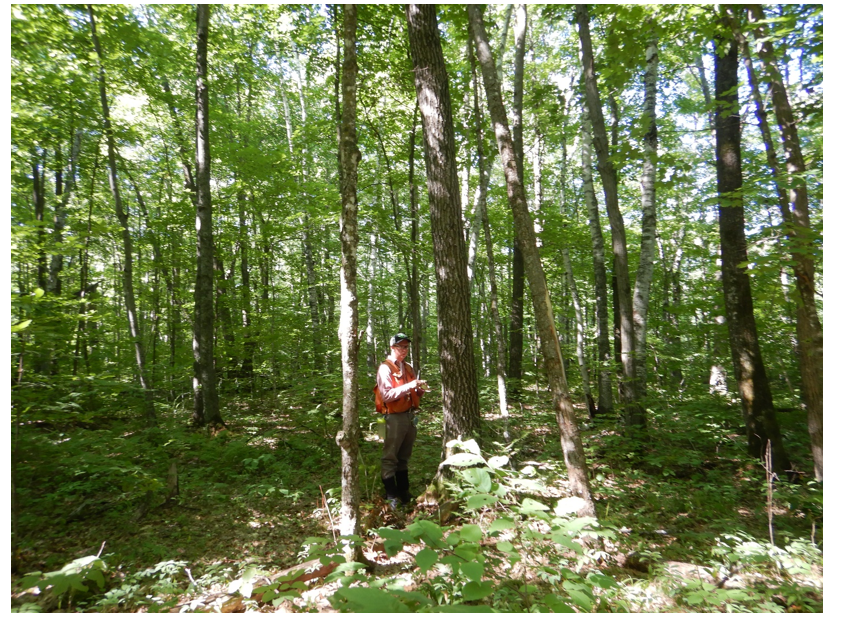
• Photographs of each plot showing typical species composition and growth stage.
Further details of data collection methods and analysis are outlined in Figure 7 and Figure 8.
Silviculture Objectives
- Hardwood thinning to improve crop tree growth, timber quality, stand health and mast production for wildlife.
- Capture merchantable aspen volume before mortality.
Pre-treatment stand description and condition
There are 23 separate sites in the study, each with a different origin year. The stands ranged from 56 to 108 years old. Many hardwood stands in the Aitkin Area originated after the control of fires post-European settlement. Table 1 shows characteristics for the 23 study sites.
Table 1: MN DNR forest inventory stand number, site index, NPC, and acres for the 23 study sites.
Site Number | Species | Site Index | NPC | Site Acres |
746 | Northern Red Oak | 55 | MHn35 | 18.2 |
652 | Northern Red Oak | 58 | MHn35 | 118.1 |
786 | Northern Red Oak | 59 | MHn35 | 22.4 |
393 | Northern Red Oak | 53 | MHn35 | 113.6 |
365 | Northern Red Oak | 58 | MHn35 | 107.9 |
327 | Northern Red Oak | 70 | MHn35 | 37.6 |
160 | Northern Red Oak | 58 | MHn35 | 163.1 |
603 | Northern Red Oak | 64 | MHn35 | 31.9 |
516 | Northern Red Oak | 55 | MHn35 | 126.7 |
144 | Northern Red Oak | 70 | MHn35 | 29.2 |
42 | Northern Red Oak | 62 | MHc26 | 28.5 |
38 | Northern Red Oak | 62 | MHc26 | 37 |
54 | Northern Red Oak | 56 | MHc26 | 22.9 |
171 | Northern Red Oak | 68 | MHc26 | 21 |
64 | Northern Red Oak | 54 | MHc26 | 13.6 |
218 | Northern Red Oak | 60 | MHc26 | 14.5 |
226 | Northern Red Oak | 60 | MHc26 | 42.3 |
128 | Northern Red Oak | 63 | MHc26 | 31.3 |
98 | Northern Red Oak | 67 | MHc36 | 134.5 |
222 | Northern Red Oak | 62 | MHc36 | 104.6 |
548 | Northern Red Oak | 58 | MHn44 | 16 |
89 | Northern Red Oak | 67 | MHc47 | 36.2 |
300 | Northern Red Oak | 67 | U/A | 37.8 |
Pre-treatment species composition
Stands included a mixture of central and northern hardwoods species, including red oak, aspen, red maple, paper birch, basswood, black ash, green ash and sugar maple.
Pre-treatment forest health issues
None noted.
Landowner objectives/situation
While specific objectives vary from parcel to parcel, lands under the administration of DNR-Forestry are managed in alignment with Section Forest Resource Management Plans (SFRMP) to ensure that state forest management activities meet statewide goals for ecological protection, timber production, wildlife habitat and cultural/recreational values. The DNR assembles teams from the Divisions of Forestry, Fish & Wildlife, and Ecological & Water Resources who work with partners and the public to develop SFRMPs.
The Minnesota DNR goal in these forest types is to manage to reduce negative forest health impacts, grow quality sawtimber, and have a widely distributed age class structure. Sites are managed consistent with goals outlined in the Western Superior Uplands (WSU) SFRMP for: site productivity, forest health, habitat, age class structure and other benefits.
Silviculture prescription
The following series of treatments were implemented:
Treatment | Date | Description | Acres Treated |
Silvicultural assessments and timber sale appraisals | 1990-2013 | Timber was appraised for sale and stands were assessed to determine a silvicultural strategy. | 1309 |
Thinning harvests | 1990-2013 | Harvest all marked trees and any aspen to provide a crown release to crop trees on two or three sides. Residual basal area targets during marking were 90-100 square feet of basal area per acre. | 1309 |
What actually happened during the treatment
Harvests generally occurred in winter except on well drained sites during dry years. There was potential for site impacts (rutting, compaction) on certain sites during wet years, especially early in the winter, but not enough to quantify. Damage to residual trees was low to non-existent. Harvesting equipment was almost always conventional, with slash redistribution across the harvest area. While residual basal area targets during marking were 90-100 ft2/acre, site assessments 10 years post-thinning suggest that residual basal area was closer to 80-90 ft2/acre.
Post-treatment assessment
Table 2: Average Annual Red Oak % Post-thin Growth Change, Diameter Growth, and Annual Basal Area (BA) Ingrowth Since Thinning
*Site #s 64 and 171 show negative basal area ingrowth since thinning. It is likely that this is due to measurement error, and therefore these sites were not used for basal area analysis.
Site # | NPC | Oak Site Index | Year of Last Thin | Age at last thin | % post-thin vs. pre-thin growth change | Average annual diameter growth of trees since thinning (inches) | Annual BA in-growth since thinning (ft2/ac.) | Stand BA in 2019 |
746 | MHn35 | 55 | 2004 | 69 | 8% | 0.199 | 2.7 | 120 |
652 | MHn35 | 58 | 2000 | 80 | 8% | 0.241 | 1.4 | 106 |
786 | MHn35 | 59 | 1995 | 52 | 65% | 0.321 | 2.0 | 128 |
393 | MHn35 | 53 | 2004 | 67 | 46% | 0.201 | 0.5 | 88 |
365 | MHn35 | 58 | 2004 | 64 | 58% | 0.408 | 2.8 | 122 |
327 | MHn35 | 70 | 2010 | 75 | 21% | 0.229 | 0.4 | 89 |
160 | MHn35 | 58 | 2008 | 81 | 22% | 0.234 | 2.1 | 113 |
603 | MHn35 | 64 | 2010 | 89 | Unk | 0.153 | 1.7 | 92 |
516 | MHn35 | 55 | 2010 | 77 | Unk | 0.158 | 1.7 | 83 |
144 | MHn35 | 70 | 2010 | 70 | Unk | 0.137 | 1.9 | 103 |
42 | MHc26 | 62 | 2008 | 74 | 28% | 0.367 | 2.0 | 112 |
38 | MHc26 | 62 | 2008 | 69 | 12% | 0.193 | 2.8 | 121 |
54 | MHc26 | 56 | 2013 | 75 | 58% | 0.289 | 1.2 | 104 |
171 | MHc26 | 68 | 2013 | 70 | 22% | 0.428 | -4.2* | 68 |
64 | MHc26 | 54 | 2013 | 84 | 63% | 0.275 | -2.0* | 78 |
218 | MHc26 | 60 | 2009 | 77 | 31% | 0.279 | 1.1 | 84 |
226 | MHc26 | 60 | 2008 | 82 | 26% | 0.253 | 4.4 | 138 |
128 | MHc26 | 63 | 2009 | 52 | Unk | 0.181 | 2.5 | 89 |
98 | MHc36 | 67 | 2008 | 73 | 22% | 0.196 | 2.8 | 116 |
222 | MHc36 | 62 | 2008 | 73 | 39% | 0.303 | 2.5 | 112 |
548 | MHn44 | 58 | 2013 | 102 | Unk | 0.180 | 1.6 | 67 |
89 | MHc47 | 67 | 2008 | 73 | 41% | 0.225 | 2.2 | 114 |
300 | U/A | 67 | 2005 | 86 | Unk | 0.101 | 1.5 | 110 |
Averages | 33.5% | 0.241 | 1.6 | 103 | ||||
Notes on conclusions and data limitations
When we began this study, we had initially hoped to be able to determine average overall red oak diameter growth response after thinning across all sites, and to tease out differences in rate of growth pre- and post-thinning by 5 different predictors:
- Stand age class
- Native Plant Community (NPC)
- Site index (SI)
- Prior stand management
- Several additional species, including sugar maple and basswood
After gathering all usable data we could find, we have determined that we only have adequate data to share some conclusions on the impacts of 4 predictors:
- Average overall red oak diameter growth response after thinning across all sites. This is the factor for which we have the greatest confidence, since it is the one where we have the most data.
- Red oak growth response differences after thinning for stands 60 years or older.
- Post-thinning growth response differences between NPCs MHc26 and MHn35.
- Post-thinning growth response differences by site index.
We have determined that we don’t have enough information to confidently draw conclusions on:
- Post-thinning growth response for stand ages less than 60.
- Post-thinning growth response differences between NPCs other than MHc26 and MHn35.
- Post-thinning growth response differences due to prior stand management.
- Any species other than red oak.
- Red oak growth response to thinning
- See Table 2 for a summary of post-thinning growth data.
- Average annual diameter growth increase for the 10-year period after thinning was 33.5% higher than the immediately preceding 10-year period.
- Average annual BA ingrowth for the 10-year period after thinning was 1.6 ft2/acre.
- Average annual diameter growth of trees since thinning was .241 inches.
- Influence of stand age on red oak growth responses
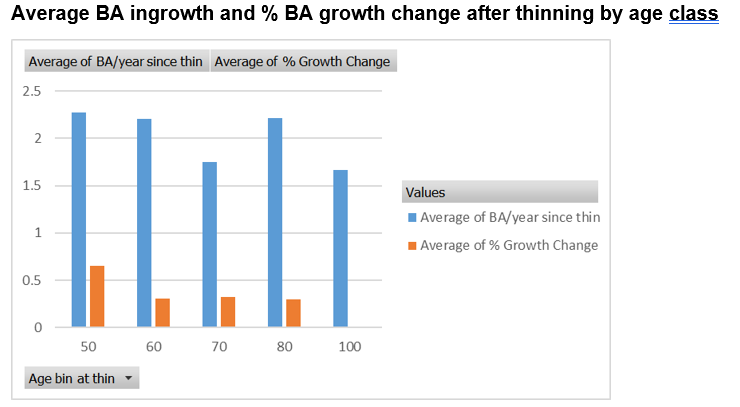
Figure 2: Average BA ingrowth and % BA growth change after thinning by age class
Overall, our data shows slight declines in growth response as stands increase in age. Basal area (BA) increment post-thinning was greatest in 50 to 60 and 60 to 70 year-old stands, followed by 80 to 90 year old. Percent (%) growth change following thinning was greatest for 50 to 60 year old stands and decreased in older stands.
It is important to note that additional stand factors such as site index, NPC and past management practices interact with stand age to influence growth rates.
- Influence of NPC on red oak growth response to thinning
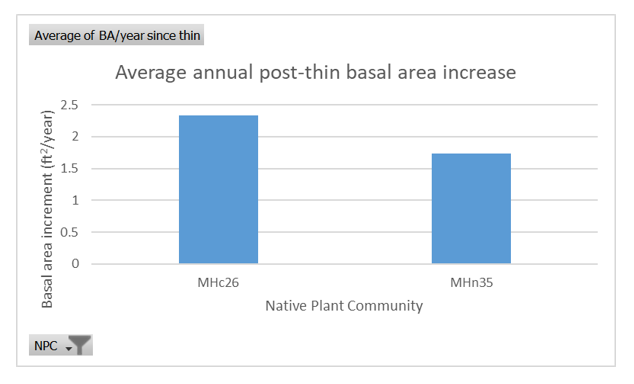
Figure 3: Average annual post-thin basal area increase for 2 NPCs
We feel that we have adequate data to show red oak thinning response for 2 NPCs: MHc26 and MHn35. Our data shows a higher average annual post-thinning BA increase in the relatively drier, richer MHc26 NPC type than in the MHn35 type. We feel that we do not have enough data in this study to draw or support any conclusions related to MHc47, MHn35 or MHn44. We think it would be valuable if a future study added enough data for these NPCs to make additional NPC comparisons.
Impact of site index on stand basal area ingrowth
Our data shows that stands with Site Index 60 or greater had about 22% higher average annual post-thin basal area ingrowth than stands with SI less than 60 (2.16 ft2/acre vs. 1.77 ft2/acre).
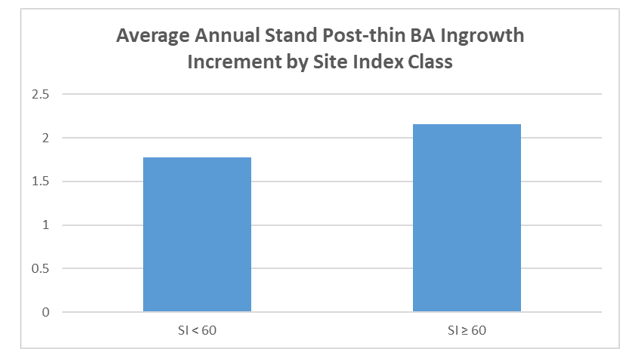
Figure 4: Average annual stand post thin BA ingrowth increment by site index class. Sites with SI > 60 had 22% higher annual growth on average.
Observation on thinning re-entry period
Our current re-entry period is 20-years following a thinning. We were interested in assessing if that is an adequate time period, or if we should re-examine the stand earlier or later than that.
In 2019, an average of 11.3 years after thinning, stands averaged 102.5 ft2/acre of BA. Stands averaged 1.55 ft2/acre of BA ingrowth after thinning. Assuming a slightly more conservative annual average BA ingrowth of 1.4 ft2/acre, we project an average post-thin BA of 114.7 ft2/acre 20 years after thinning.
In our opinion, this illustrates that the current 20-year period before re-entering stands to examine them for a thinning decision is reasonable.
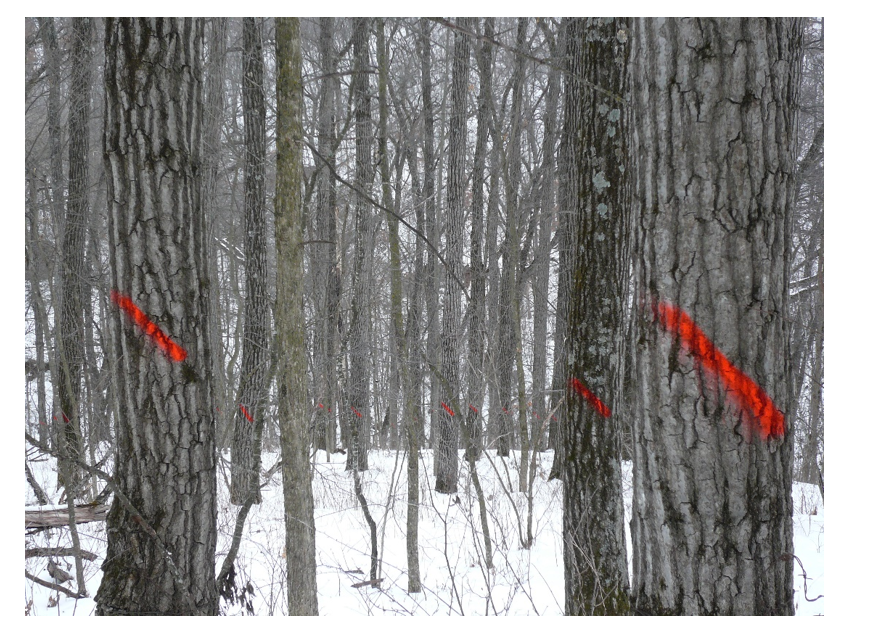
Figure 5: A hardwood stand marked for thinning
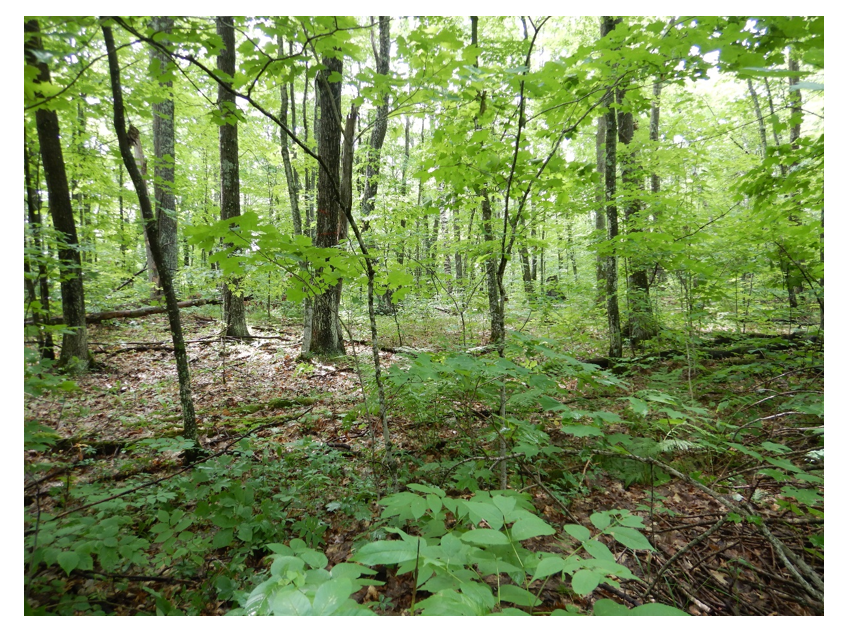
Figure 6: Site 786 in summer 2020
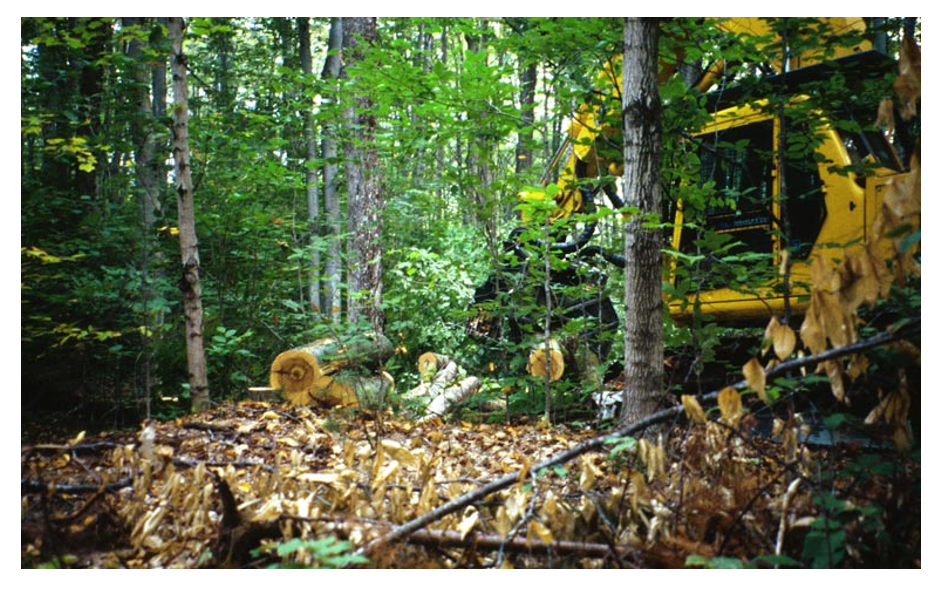
Figure 7: Hardwood thinning in progress
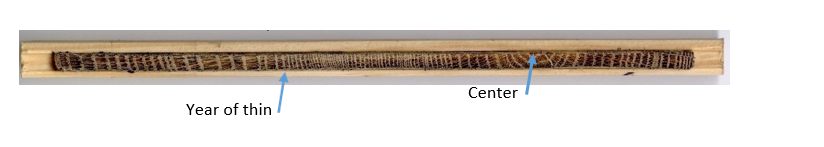
Figure 8: Sample tree core showing increased radial growth after thinning
Plans for Future Treatments
Maintain the stands through crop tree release thinnings when basal areas and timber volume reach a point that supports a commercial timber harvest. Begin regeneration process approximately 20 years before the rotation age dictated by the current WSU SFRMP (120 years for SI 75+, 150 years for SI<75) using a timber harvest to alter light levels and species composition so that regeneration treatments at the planned age are successful at achieving an oak component.
Costs and economic considerations
Table 3: Net Present Value (NPV) for oak/mixed hardwoods management in the Aitkin forestry area
MNDNR Oak/Mixed Hardwoods Cover Type NPV Aitkin Area | |||||||
Age | Treatment (a) | Cords/Acre | Price/Cord | Gross Value/ Acre (b) | Cost/Acre (c) | Net/Acre (d) | NPV/Acre (e) |
50 | Thin | 10.0 | $12 | $120 | ($300) | ($180.00) | ($41.06) |
70 | Thin | 11.0 | $15 | $165 | ($300) | ($135.00) | ($17.05) |
90 | Thin | 12.0 | $20 | $240 | ($300) | ($60.00) | ($4.20) |
110 | Thin | 12.5 | $25 | $313 | ($300) | $12.50 | $0.48 |
130 | Clearcut | 27.0 | $30 | $810 | ($150) | $660.00 | $14.15 |
Sum | ($47.67) | ||||||
Table Notes |
|
|
| ||||
a) Thinnings/crop tree release are marked, Rotation Age= 150 from STH Western Superior Uplands, April 2019. | |||||||
b) Gross stumpage value at time of harvest. | |||||||
c) Timber sale cost per acre at time of harvest; $300/acre marked sales and $150/acre clearcut. d) Net stumpage value per acre at time of harvest. e) Net present value per acre, real discount rate = 3% | |||||||
While this analysis shows a negative NPV for management over a full rotation, we point out that hardwood stand management with thinning is a good investment for Minnesota’s citizens to ecological and economic benefits oak forests provide. There are multiple benefits of hardwood thinning including:
- Facilitating oak regeneration. As stands near the age where they need to be regenerated, thinning can establish light and competition conditions favorable to regenerating an oak component.
- Improving wildlife habitat. Thinning can result in several habitat benefits, including increased mast production through larger, more healthy crowns of mast-producing trees.
- Building resilience to a changing climate and forest health threats. Thinning can remove diseased and/or unhealthy trees and help to maintain or increase species diversity.
- Increasing economic impacts through forest management. Thinning can help to establish and maintain a component of trees with high timber value, which can result in the ability to better use market forces through timber harvest to shape the forest in beneficial ways in the future. Finally, while NPV of timber management may be negative, the value-added impact of forest products provided is extremely positive and very significant to Minnesota’s economy:
As of the last analysis in 2017 for Minnesota, there were 34,055 direct jobs in the forest products industries, and overall, 78,465 jobs were supported. Direct labor income was $2.4 billion, with total labor income at $5.1 billion. Direct value-added was $3.6 billion, and the total contribution for value-added was $7.9 billion. Finally, direct output was $10.5 billion with a total contribution of $18.1 billion in output. Source: MNDNR publication “Forest Products Industries’ Economic Contributions: Minnesota, March 2020”.
Other notes
Field data would be available by request to MNDNR Aitkin Area Forestry silviculture program staff.
We gratefully acknowledge the data-gathering assistance of Interns Cody Martin, Annamarie Andreason and Pam Miksell, and the review and editing assistance of MNDNR Forestry Silviculture Program Coordinator Mike Reinikainen.
Tree core data was measured with assistance from the University of Minnesota’s Silva Lab Group in the Department of Forest Resources.
This case study was developed with support from the United States Department of Agriculture's National Institute for Food and Agriculture, Renewable Resources Extension Act. Project #2021-46401-35956, principal investigator Eli Sagor, University of Minnesota.
Summary
Key Takeaways
1. Red oak growth response after thinning
Our data show that oak response to crop tree release thinning was largely positive.
2. Influence of age on red oak growth responses
Our data show slight declines in growth response as stands increase in age.
3. Influence of NPC on red oak growth response to thinning
Our data show higher average annual post-thinning BA growth in the drier, richer MHc26 NPC type than in relatively wetter, poorer MHn35 NPC type.
4. Impact of site index on stand basal area ingrowth and first thinning entry
Our data show that stands with site index 60 or greater had higher average annual post-thin basal area ingrowth.
Due partly to an age-class imbalance toward older stands, the oak stands on most examination lists are well past standard rotation age. Earlier first examinations for potential thinning of higher site index stands would enable silvicultural treatments to improve stand health, timber value, wildlife habitat, and oak regeneration potential.
We recommend engagement with MNDNR Forest Planning staff to explore opportunities to more broadly incorporate thinning regimes into oak forest type stands with a site indices of 55+.
NOTES: Current MNDNR standard criteria for stand selection for a first stand examination:
- Oak stands treated as even-aged. Standard rotation age for most sections = 80 years. Western Superior Uplands = 150 years.
- Central hardwoods treated as uneven-aged. First stand exam at minimum age 30
- Northern hardwoods treated as uneven-aged. First stand exam at minimum age 40
Observation on thinning re-entry period
In our opinion, our data illustrates that the current 20-year period before re-entering stands to examine them for a thinning decision is reasonable.
There are multiple benefits of hardwood thinning
We include here a general reminder to readers that hardwood thinning has many important benefits, including:
- Facilitating oak regeneration.
- Improving wildlife habitat.
- Building resilience to a changing climate and forest health threats.
- Increasing economic impacts through forest management.
We will make our data available to the DNR Forest Modeler for use in refining growth models.
One of the objectives for this case study was to calculate stand-level basal area in-growth since thinning harvest for potential use in refining growth models.
Supplemental content
Sandstone Oak Epicormic Branching Study Data Collection Protocols and Calculations
Plot Establishment
Survey the stand and identify the portions of the stand that fall into one of three categories. Low Basal Area (BA) (0-70), Mid BA (71-100) and High BA (101+). Establish 3 plots within each category with painted rebar at plot center. Record GPS coordinates for each plot. (Note: A particular stand may not have all three BA categories present.) Identify each plot by its stand number, BA Category and plot number. For example “300-LOW-2”.
Data Collection
On each plot a 10-factor prism was used to determine “in” trees. The following information was recorded for each:
- Plot number
- FIM stand number
- Date
- Current Basal Area
- Total number of epicormic branches in the lower 2 logs (32 feet) of all trees
- On the first plot tree encountered going clockwise from due north collect this additional data:
- DBH
- Crown Canopy Class (Suppressed, Intermediate, Co-Dominant or Dominant)
- One increment core taken from as low on the bole as possible
Calculations
Average total post-thin tree diameter growth: Determined for each site.
Sum of the number of post-thinning rings in sample core for each tree/Number of trees sampled.
Average annual post-thin diameter growth:
Average total post-thin tree diameter growth/# of years since thinning
Estimated tree DBH immediately post-thin:
Average DBH of sampled trees minus Average total post-thin diameter growth
Estimated current trees/acre
Current average stand BA/(0.005454*(Current average tree DBH2))
NOTE: .005454 is the constant number used to convert tree diameter in inches, to the BA of this tree in ft2.
Estimated basal area immediately post-thin:
(0.005454*(R2))*Estimated current trees/acre
Aitkin Area Intensive Hardwood Inventory (IHI) Data Collection Protocols
Objective
The main purpose of IHI is to gather data to inform development of a silvicultural prescription. Data gathered will help answer the questions below as a prescription is developed:
- Is basal area high enough to support a commercial thin?
- Is there enough quality timber to so sawlog management should be a prescription objective?
- Is stand age and condition such that we should begin the regeneration process? Examples might include beginning to alter the species mix and light conditions to favor oak regeneration.
Data Gathering
Data will be gathered on a minimum of one variable radius plot (10 BAF) for every three acres.
Record all basal area data for diameter size classes six inches and larger by diameter class, species and quality class, and other criteria as defined below:
Tree Classes
Quality Tree: Is currently producing or will produce twenty-four feet of sawtimber to a ten-inch top diameter. The tree will have at least three clear faces with no defects, and will have no defect greater than three inches on the other face. The tree will be straight and sound.
Average Tree: Is currently producing or will produce sixteen feet of sawtimber to a ten-inch top diameter. The tree will be at least seventy-five (75) percent sound; sweep not greater than diameter; crown is healthy and tree will respond to release; tree will have at least one clear face.
Cull Tree: Pulpwood quality or will not respond to release. Quality is affected by form or disease.
Den Tree: A standing live tree where disease or decay has created a cavity. A den tree may be tallied as a “cull” tree and a “den” tree. Den and snag tree data is important to accurately record.
Snag Tree: A standing dead tree at least twelve (12) feet tall.
Defects:
- Frost Crack: is not considered a defect if frost crack is straight.
- Dead Branches or Stub: is not considered a defect if branch or stub is less than two inches on trees greater than ten inches.
- Bump: is not considered a defect if height to length ratio is 1:3 or more.
Data Analysis
All basal area data for each type was then summarized by size class, species, and quality class.
Current (2019/2020) Intensive Hardwood Inventory data was used to compare stand density to historic stand density (measured through previous hardwood inventories), and post-thinning forest inventories.
Selecting Trees to Core
At least five dominant or codominant trees of each main species that had been released on at least two sides during the last thin, well-distributed across the site, were selected and cored.
Performing Growth Increment Analysis
Tree cores were preserved and sent to the University of Minnesota Silviculture Lab where they were analyzed by counting tree annual growth rings to establish date of stand origin and measure growth increment through the life of the tree.
Details of their procedure follow:
Cores were sanded using a belt sander with 200 grit sandpaper and then 600 grit sandpaper to enhance the visibility of annual rings.
Cores were scanned using an Epson Expression 12000XL scanner.
Annual rings were counted and measured using DendroElevator.
Rings were measured from pith to bark with one increment per year.
Establishment year was subtracted from the sample collection year to determine tree age.
Summary statistics were calculated in Microsoft Excel.
Supplemental Table 1: Locations of the 23 study sites.
Locations of 23 Post-Thinning Radial Growth Study Sites | |||
Site Number | Legal Description | Easting | Northing |
746 | S21 T44N R22W | 490233 | 5125766 |
652 | S18 T50N R26W | 447165 | 5185418 |
786 | S19 T44N R22W | 487774 | 5125353 |
393 | S21 T44N R22W | 489574 | 5125694 |
365 | S21 T44N R22W | 488985 | 5125198 |
042 | S16T46N R25W | 461168 | 5145619 |
038 | S16 T46N R25W | 461163 | 5145825 |
327 | S12 T44N R23W | 484756 | 5128109 |
160 | S14 T45N R27W | 444443 | 5135989 |
98 | S23 T45N R27W | 445750 | 5135102 |
89 | S24 T45N R27W | 446376 | 5134843 |
222 | S26 T45N R27W | 444930 | 5133974 |
54 | S22 T46N R25W | 462633 | 5144130 |
171 | S22 T46N R25W | 462493 | 5144021 |
64 | S28 T46N R25W | 461995 | 5143832 |
218 | S36 T47N R25W | 466059 | 5151227 |
226 | S36 T47N R25W | 465833 | 5150314 |
603 | S32 T44N R16W | 547066 | 5122124 |
548 | S33 T44N R16W | 548087 | 5122862 |
516 | S33 T44N R16W | 548900 | 5122609 |
128 | S22 T41N R17W | 539729 | 5096908 |
144 | S10 T43N R17W | 540302 | 5118326 |
300 | S25 T42N R17W | 543251 | 5103816 |
Submitted by
Chris Bergquist
Troy Holcomb
Matt Huseby
Keith Jacobson
Mike Reinikainen
St. Paul, MN 55155